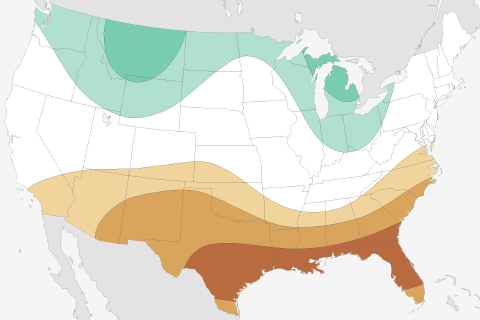
What are NOAA's predictions for this possible La Niña winter of 2016-17, and how did its predictions for last winter fare during the strong El Niño? Guest blogger Mike Halpert gives us the lowdown.
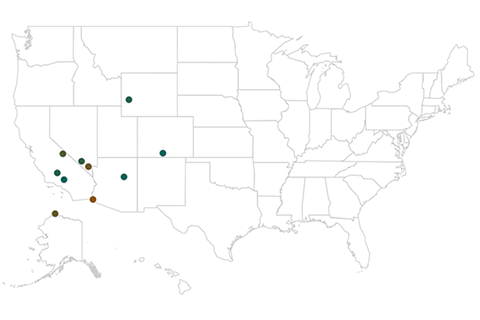
Unlike the United States' extreme temperature places, which are dominated by where you sit on a map, the extreme precipitation places tend to be dominated by what features are near you. We'll explore the driest and wettest places in the United States.
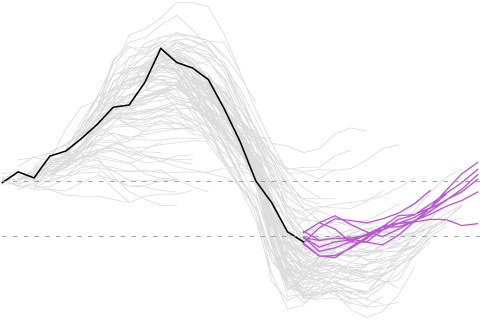
Because why go to the movies when you come to Climate.gov and watch the evolution of ENSO forecasts over the past two years?
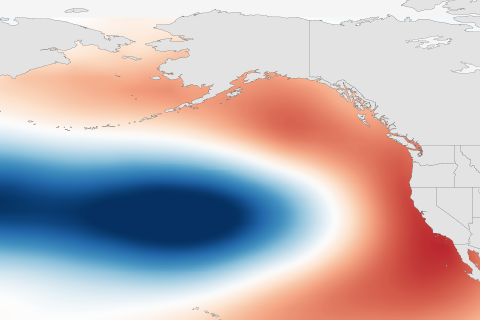
Understanding the Pacific Decadal Oscillation (PDO) as multiple layers of ice cream. And how is it related to the El Niño-Southern Oscillation?
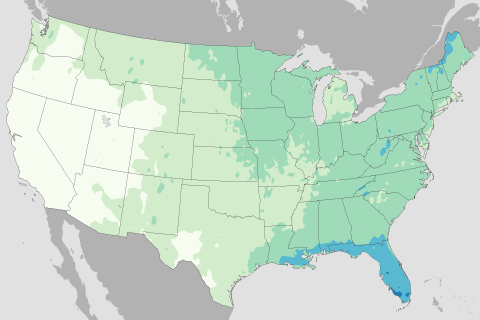
In this Beyond the Data blog, Deke Arndt talks about using the climate record to predict the odds of rain on the Fourth of July.
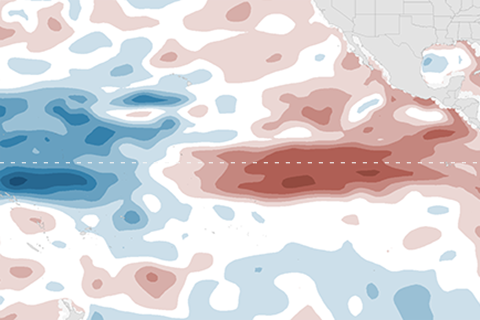
Crack out the popcorn, sit back, and marvel over the decay of El Niño.
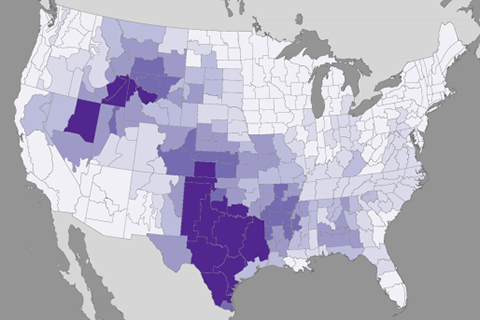
This week's Beyond the Data blog examines how spring precipitation influences summer temperatures, and why this matters a little more in land-locked areas. Flyover Country, from one of your native sons, this blog’s for you.
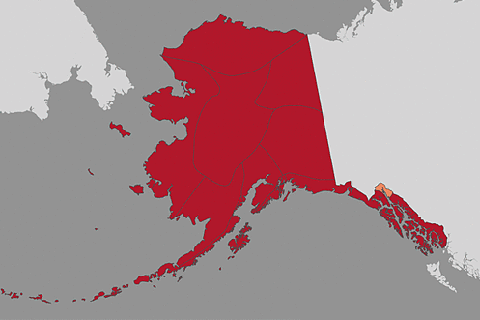
Alaska’s statewide warming rate of +5.3°F per century since 1950 is faster than any other state in the Union, by a comfortable margin. In our latest Beyond the Data blog, NCEI's Deke Arndt talks about how the interplay between climate and landscape and the soil itself put the Last Frontier on the front lines of climate change.
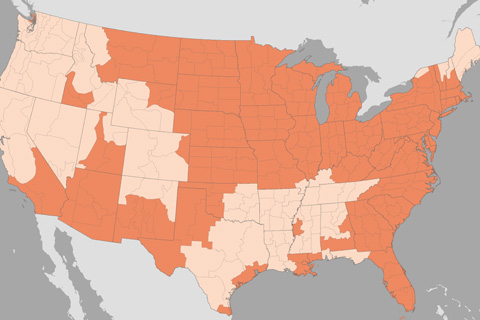
Every one of the 357 climate divisions across the contiguous United States and Alaska ended up—at least—in the “warmer than normal” category. In this week's Beyond the Data blog, Deke Arndt explains why that's harder to do than it sounds.

The 2015-2016 El Niño will go down as one of the strongest on record, and also, thanks to El Niño Rapid Response Campaign, one of the best observed.