
In recent decades, the Northern Hemisphere has featured a “Warm Arctic, Cold Continents” (WACC) pattern: warming and rapid sea ice loss of the Arctic, and frequent cold, harsh winters over Eurasia and central North America. A new study, funded in part by CPO’s Climate Variability and Predictability (CVP) program, investigates the drivers of year-to-year variability in the WACC.
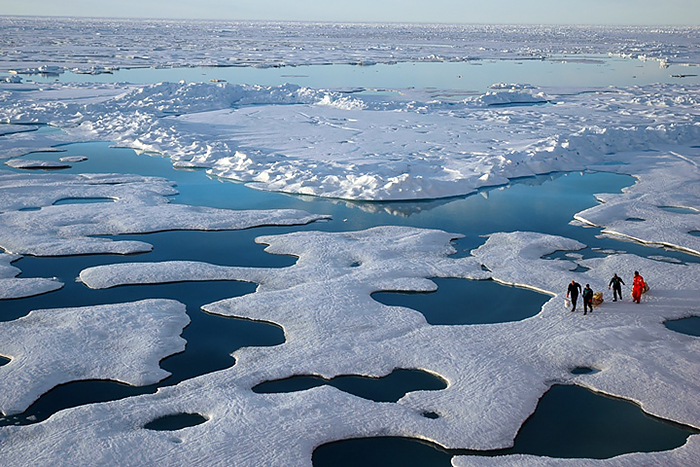
A new study supported by NOAA Climate Program Office’s Climate Variability and Predictability (CVP) program, led by CIRES and the University of Colorado Boulder, uses maps built with machine learning to identify large-scale atmospheric patterns that are linked with the start of seasonal sea ice melt in the Arctic.

A newly released report, “The State of Climate Knowledge 2021,” outlines New York City’s climate research priorities, and identifies knowledge gaps for future study. NOAA’s Consortium for Climate Risk in the Urban Northeast (CCRUN) coauthored the report.
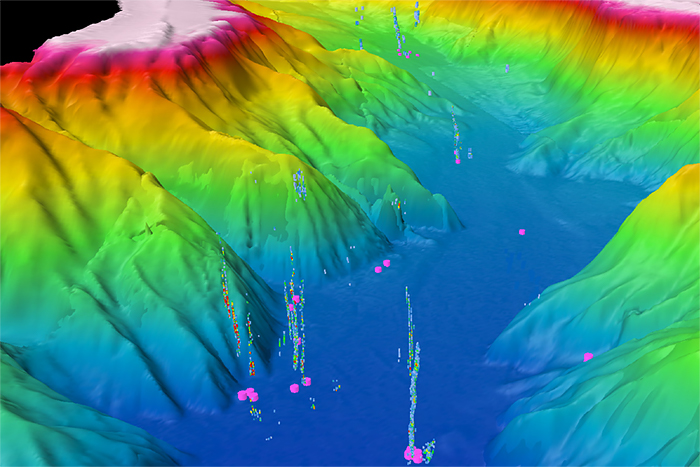
Although the West Coast continental shelf has long been known to host methane bubble streams, scientists used to think those streams were rare. A new study in Frontiers of Earth Science suggests there are more than 1,300 emission sites between California and Canada.
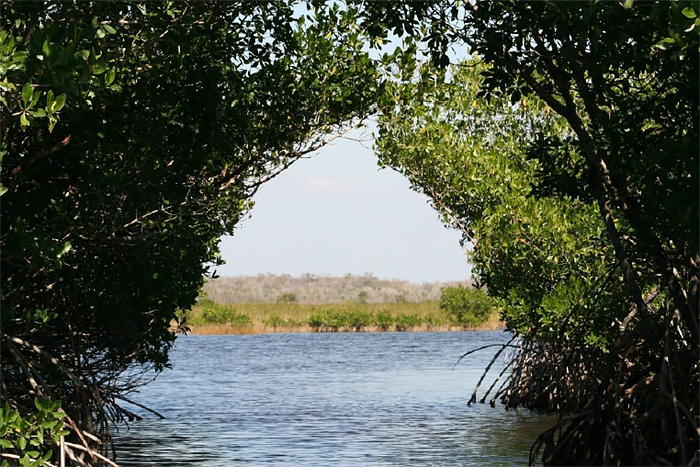
“Blue carbon” is carbon dioxide that the world’s ocean ecosystems remove from the atmosphere, through algae, mangroves, and other means. CPO has developed a briefing sheet for the newly launched NOAA Blue Carbon Inventory (BCI) Project you can review to learn more.
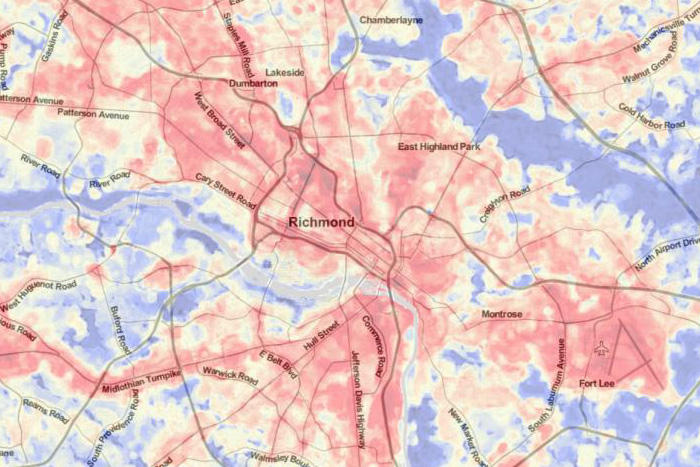
Extreme heat kills more Americans than any other weather event, but not everyone’s risk is the same. Within the same city, some neighborhoods can be up to 20°F hotter than others. In the summer of 2021, community-led campaigns will map the hottest parts of cities in 11 states: Albuquerque, New Mexico; Atlanta; New York City; Charleston, South Carolina; Kansas City, Missouri; Raleigh and Durham, North Carolina; San Diego; San Francisco; and parts of New Jersey, Indiana, Massachusetts, and Virginia.
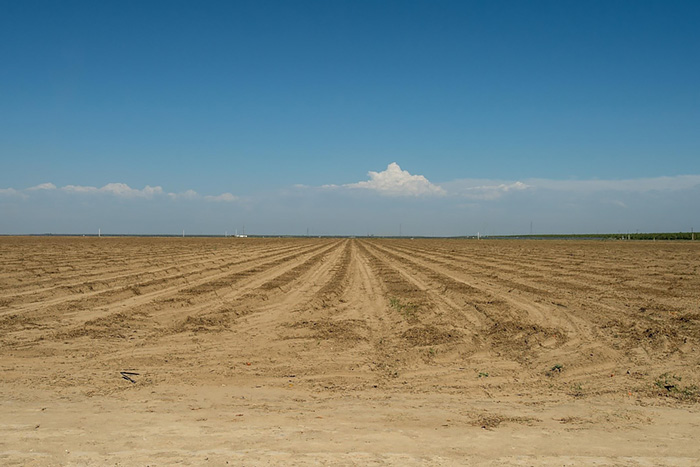
In a special collection of the American Meteorological Society, 13 papers produced by researchers from the third NOAA Climate Program Office’s Modeling, Analysis, Predictions, and Projections (MAPP) program Drought Task Force (DTF3) describe research advances leading to improved monitoring, prediction, and understanding of past droughts.

New research on the massive Australian bushfires in 2019 and 2020 shows that almost 1 million metric tons of smoke rose into the stratosphere, causing it to warm by about 1 degree Celsius for six months, and likely contributed to the large and persistent ozone hole that formed over Antarctica during the Southern Hemisphere’s spring.
Tracking greenhouse gas levels in the atmosphere, understanding ocean warming, exploring the link between climate change and hurricanes, tracking warming in the Great Lakes, and working towards climate resilience are just five examples of the many ways NOAA scientists are answering questions about climate change and its potential impacts on human societies.

As NOAA adopts 1991–2020 as the new 30-year period of record, “average” hurricane activity in the Atlantic Ocean will increase. Average activity for the new period of record means 14 named storms, 7 hurricanes, and 3 major hurricanes.