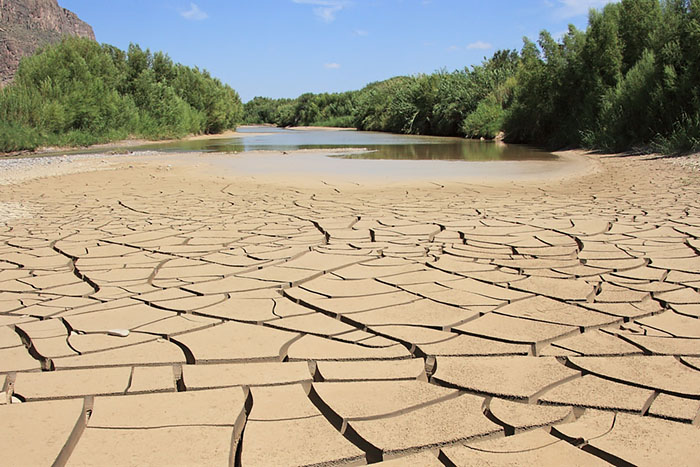
Launched on June 17, 2021, the United Nations Special Report on Drought 2021 warned of rising exposure to the natural hazard. Within the next 80 years, 129 countries will experience an increase in drought exposure mainly due to climate change, and 38 countries primarily due to the interaction between climate change and population growth.
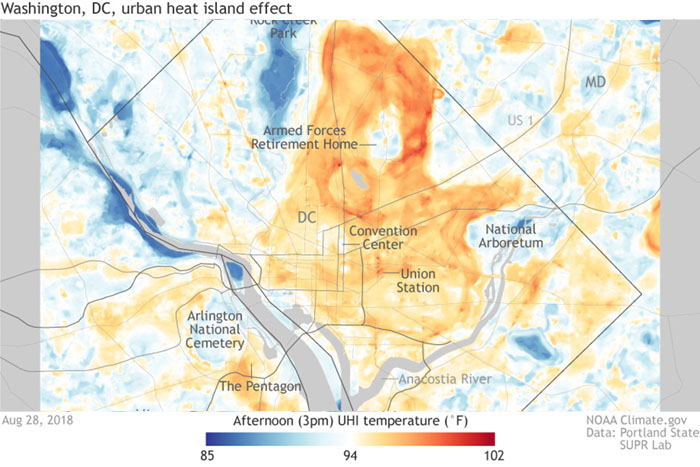
NOAA’s Climate Program Office (CPO) is pleased to announce $950,000 for four new projects that will support decision making in neighborhoods grappling with inequitably distributed impacts from the deadliest weather-related risk in the United States: extreme heat.

Summary: Multiple U.S. coastal regions may see rapid increases in the number of high-tide flooding days in the mid-2030s, according to a new study. The combined effects of sea-level rise and natural fluctuations in tidal range are anticipated to cause tipping points in the frequency of high-tide flooding. These tipping points can produce acute impacts in underserved communities not prepared for the consequences.

The Southern Hemisphere’s stratosphere is cleaner than the Northern Hemisphere’s. A NOAA-NASA airborne mission that measured very small particles and trace gases in the lower stratosphere indicated that the cause of the relatively polluted Northern Hemisphere stratosphere is aircraft emissions.

The U.S. Climate Resilience Toolkit now includes a Southeast Region section. The section features narratives, tools, and case studies on the impacts of climate change across the Southeast, and information on how people can build resilience to climate change
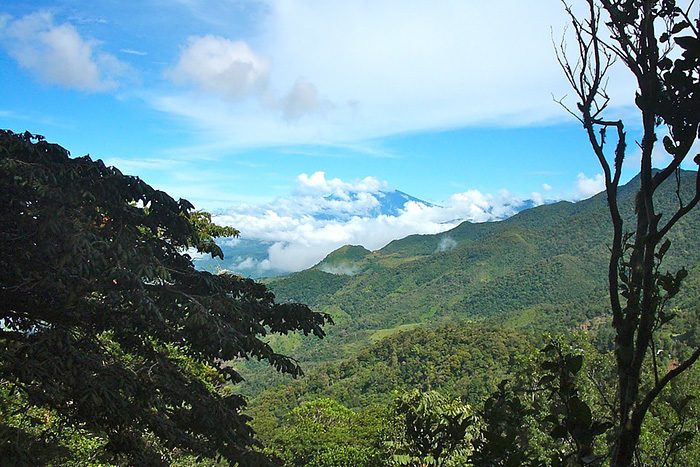
A new study finds that raising modeled mountains reduces modeled rainfall biases. By underestimating the height of mountain ranges, climate models have shown biases in their representation of the Intertropical Convergence Zone (ITCZ), a tropical rainband that delivers significant precipitation.
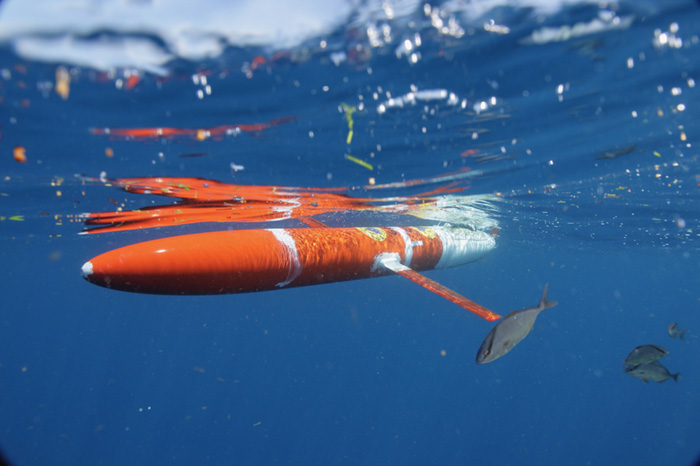
So you think you know what’s in the ocean? Even with decades of scientific research, more than 80 percent of the ocean remains unmapped, unobserved, and unexplored. That’s a lot considering more than 70 percent of the globe is covered by the ocean. NOAA is using Argo floats, gliders, drifters, and moored buoys to better understand the ocean depth

The sudden, sustained rise in atmospheric methane since 2007 has posed one of the most significant, pressing questions in climate research: Where is it coming from? By analyzing stable carbon isotope ratios, a research team identified microbial sources.
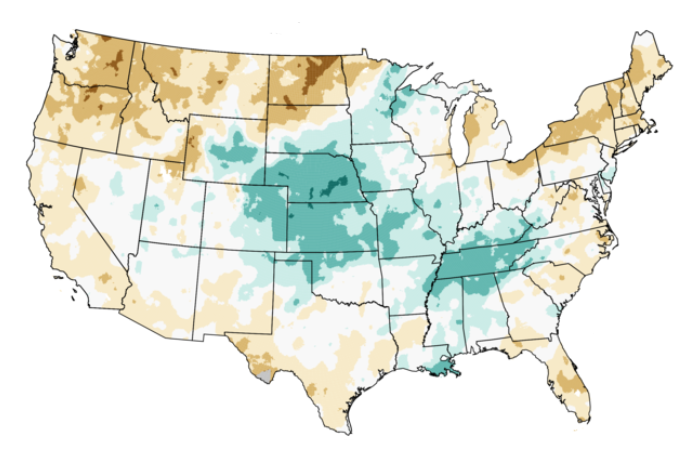
To address worsening drought in the Northern Plains, the National Integrated Drought Information System is co-hosting a webinar series this summer specifically for the Tribal Nations in the Northern Plains.
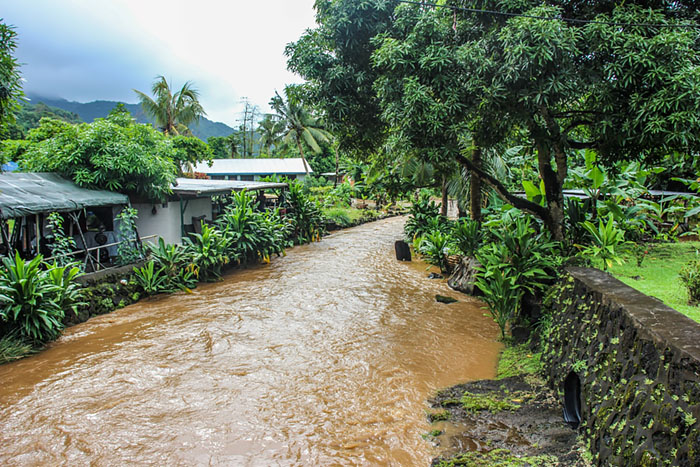
Human health risks, stronger cyclones, coral reef death, and coastal flooding are among the major challenges detailed in a new report on climate change in American Samoa published June 8, 2021. The report highlights the fact that American Samoa counts among the locations likely to see early impacts of climate change.