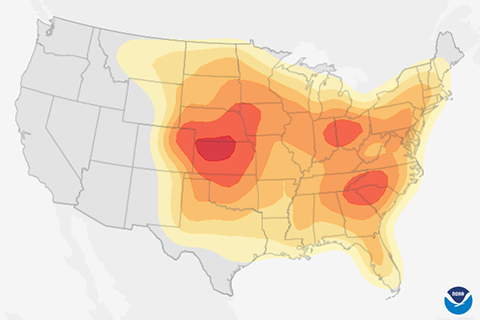
April showers bring May flowers, but what does June bring? History says mid-to-late June brings a higher probability of severe weather across much of the contiguous United States.
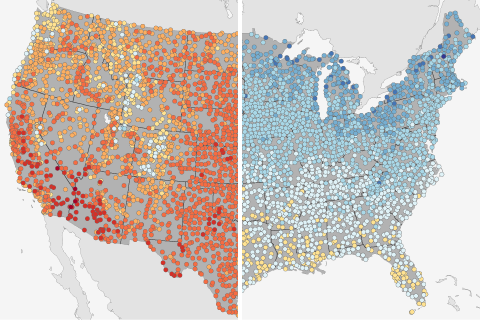
How do this year's temperatures on the first day of summer compare to historical highs and lows? Compare your local conditions to these maps showing the warmest and coldest first days of summer for more than 4,000 U.S. locations.
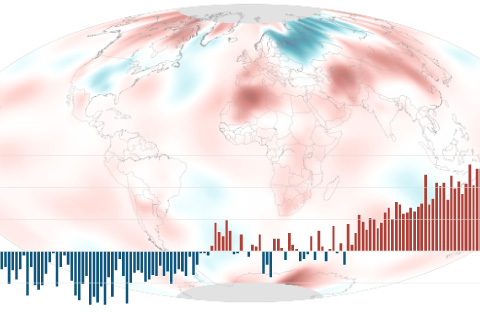
The May temperature across global land and ocean surfaces was 1.49°F above the twentieth-century average of 58.6°F. Since 1880, May temperatures have been rising by 0.13°F (0.07°C) per decade.
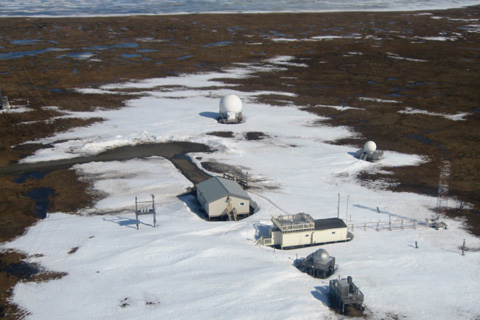
Thanks to warming winters and thawing permafrost, Arctic soil microbes are churning out carbon dioxide well after the end of the growing season ends. This extra source of atmospheric carbon may accelerate a regional warming trend that is already twice as fast as the global average.
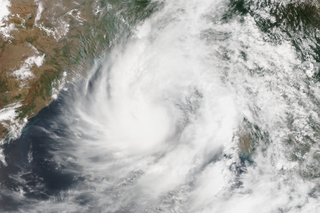
Cyclone Mora hits vulnerable Bangladesh
June 9, 2017
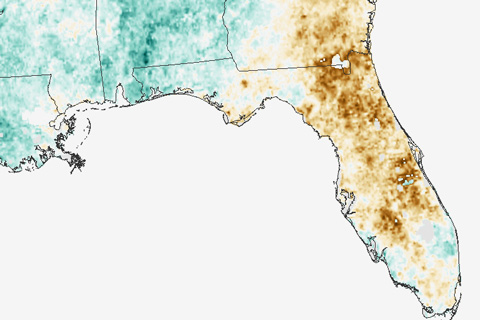
At the end of May 2017, central Florida was the only part of the contiguous United States experiencing extreme drought. These maps come from a new drought surveillance system that can detect vegetation stress without knowing anything about how much it has rained.
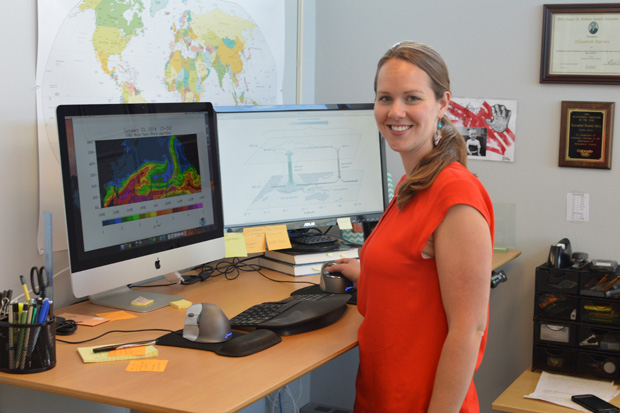
Between the weekly forecast and a seasonal outlook—and often less accurate than both—sit “sub-seasonal” weather predictions. In this profile, atmospheric scientist Libby Barnes talks about her work leading a NOAA task force whose members are trying to overcome the special challenges of forecasting over the 2-week to 2-month horizon.
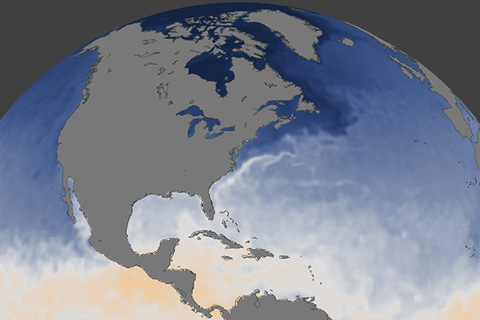
NOAA's Climate Prediction Center releases its 2017 Atlantic hurricane outlook, saying odds favor an above-normal hurricane season.
