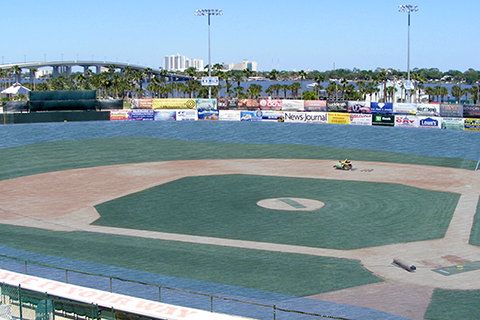
The CanVis tool from NOAA’s Coastal Services Center creates images of potential coastal changes, letting planners and citizens put changes in perspective before they happen.
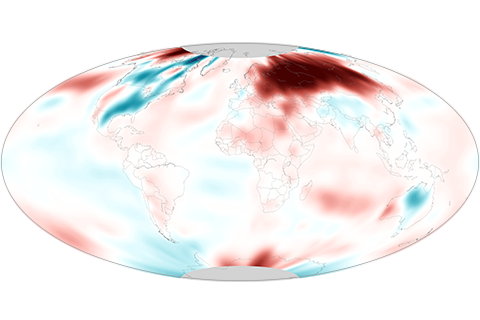
While much of the United States was cooler than average in November, the globe as a whole set a new record for warmth.
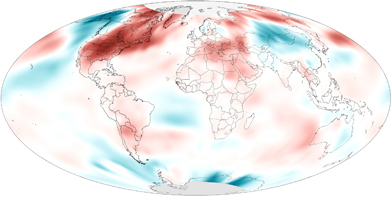
How do we know we can trust the historical surface temperature record? How do we know the rise in carbon dioxide in the atmosphere comes from fossil fuels? Did global warming stop in 1998? Get answers to these and other frequently asked questions.
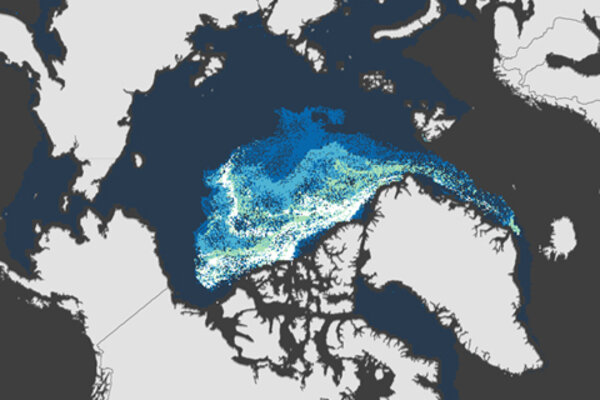
Very little old sea ice remains in the Arctic
December 13, 2013

For those of you dreaming of a white Christmas, NOAA has a map showing the historic probability of your dream coming true.
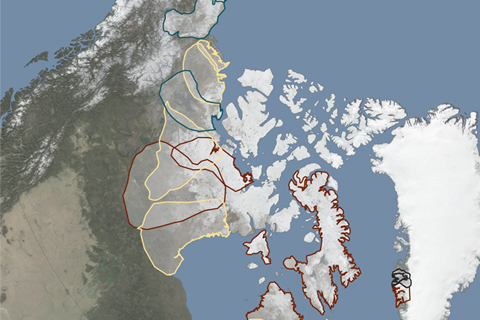
Only a few herds of reindeer and caribou are increasing or are stable at high numbers; most herds continue to decline or remain at low numbers after severe declines in recent decades. Whether these trends are a result of Arctic climate change or part of a natural pattern is still unknown.
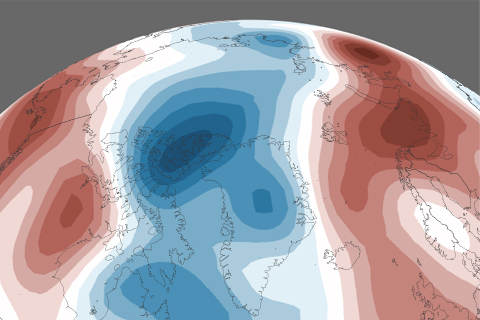
From reindeer to regional temperature patterns, from sea ice age to Greenland surface melt, the Arctic Report Card is a yearly assessment of the Arctic's physical and biological systems and how they are changing. This collection of visual highlights from the 2013 report is a story of the Arctic in pictures.
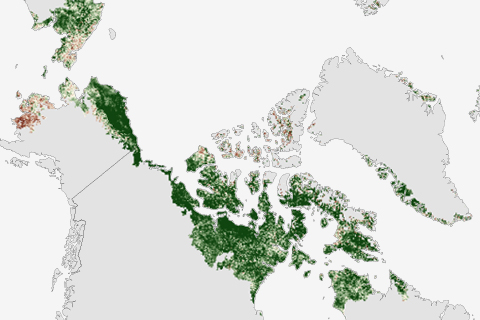
Since observations began in 1982, Arctic-wide tundra vegetation productivity has increased. In North America, the rate of greening has accelerated since 2005.
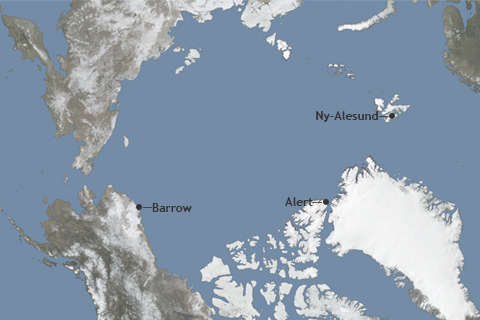
Since the early 1990s, annual atmospheric equivalent black carbon concentrations in the Arctic have decreased at the surface by as much as 55 percent—one of the few "good news" stories coming out of the region.
