
The U.S. Drought Portal offers access to maps, data, and expert assessments through easy-to-use tools designed to help decision makers monitor, plan for, and recover from water shortages.
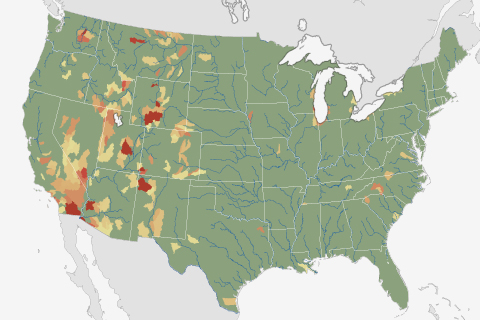
Nearly ten percent of U.S. watersheds are living beyond their means when it comes to their water supply. For nearly half the country, water stress is projected to worsen by mid-century because of climate change, according to a recent NOAA-funded analysis.
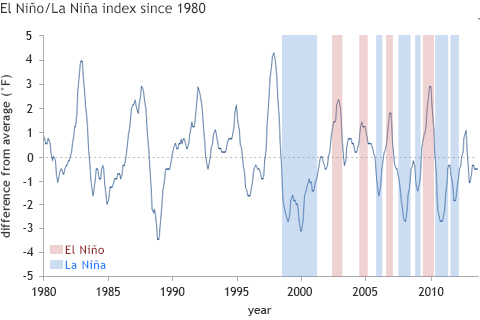
The most likely explanation for the lack of significant warming at the Earth’s surface in the past decade or so is that natural climate cycles caused shifts in ocean circulation patterns that moved some excess heat into the deep ocean.
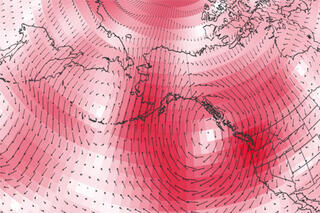
October More Like Summer Than Fall in Alaska
November 6, 2013
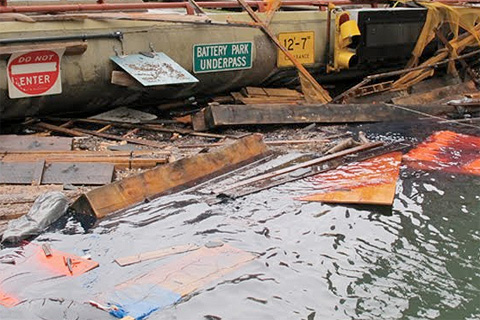
Stunned by Sandy's devastation, the city of New York undertook an ambitious project: to update its long-term sustainability plan using the latest climate science. Their goal was to understand how much sea level could rise, how soon, and just how vulnerable the city would be if some of the more extreme climate change projections turn into reality.
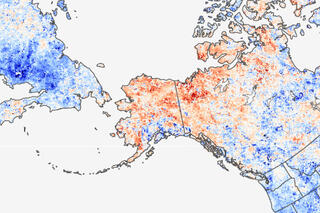
Alaska having September's Climate in October
October 30, 2013
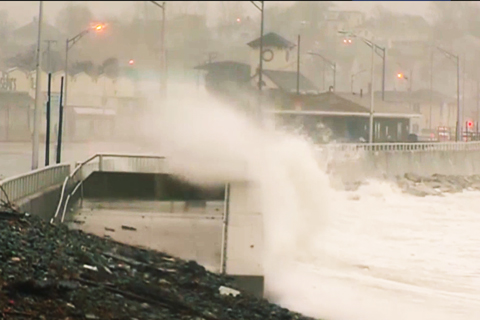
Developed by the NOAA Coastal Services Center, the sea level rise viewer offers access to data and information about the risks of sea level rise, storm surge, and flooding along the coastal United States. The Web-based map has the potential to help people build (or rebuild) in a more resilient way.
Explaining the NOAA Sea Level Rise Viewer
October 29, 2013
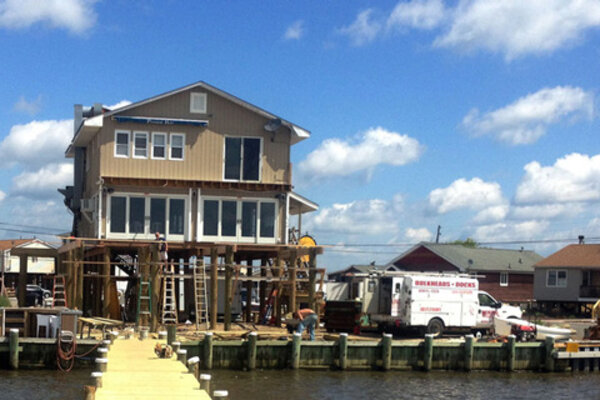
After Sandy: Facing the Future
October 29, 2013
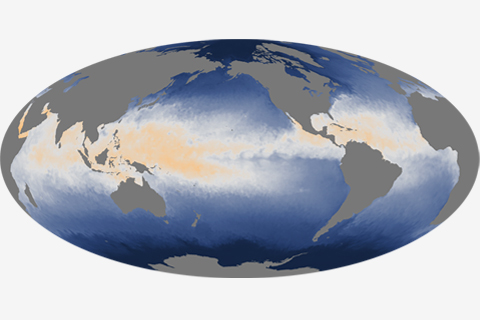
While heat is stored and mixed throughout the depth of the ocean, it is the temperature at the surface—where the ocean is in direct contact with the atmosphere—that plays a significant role in weather and short-term climate.