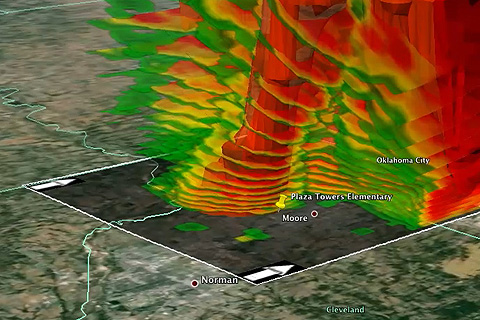
(VIDEO) Visualizing data makes it easier to understand exactly how an extreme weather event affected people’s lives, livelihoods, and property and how those things could be affected in the future. Knowing how to access and analyze the wide variety of datasets needed to study those events can be a challenge, however. NOAA's Weather and Climate Toolkit makes the job easier.
The International Academy of the Digital Arts & Sciences has chosen us as one of five nominees for the annual Webby Awards for online excellence. Please consider voting us for the People's Voice Award! Vote for us in the Government category, and vote for the "Teaching Climate" section in the Green category.
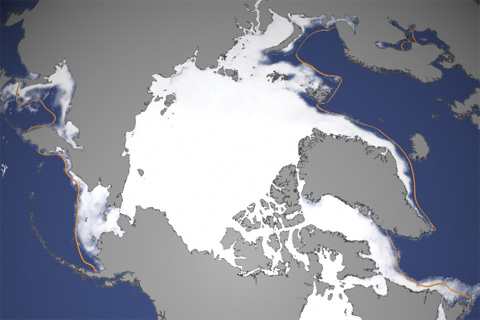
It’s finally here! Yesterday, scientists from the National Snow and Ice Data Center announced the ultimate sign of spring: Arctic sea ice reached its winter peak on March 21, 2014, and the annual melt season is underway.
Federal law may protect the river habitat in the name of endangered fish, but on land, grapevines are king. This article is the first in a two-part series about how scientists are helping find compromise amid local tensions over water supplies.
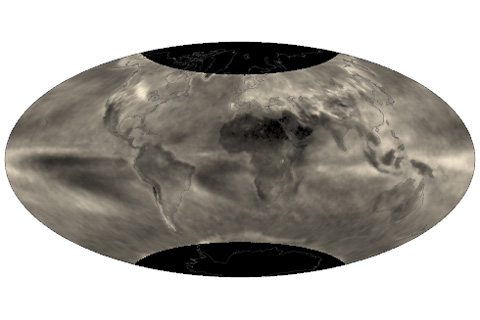
How much sunlight Earth reflects naturally varies a lot. The bigger the range of natural variability, the greater the odds that any evidence of a manmade effort to brighten up the planet would be lost in the “background noise.”

2014 Spring Climate Outlook
March 20, 2014
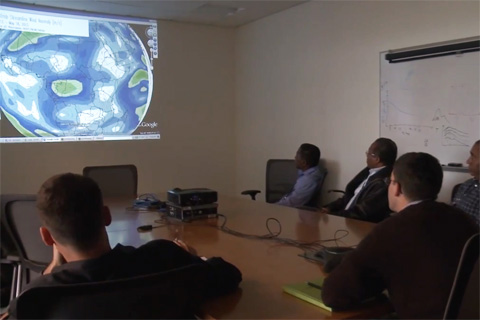
Climate change is a global phenomenon, affecting weather events around the world. Therefore, people around the globe need climate information to anticipate potentially damaging floods, droughts, crop and pest conditions, and disease outbreaks. For 20 years, the scientists at the International Desks of NOAA’s Climate Prediction Center have provided climate outlooks for weeks and months into the future and trained visiting meteorologists to translate climate data into information that can help decision makers in different parts of the world.
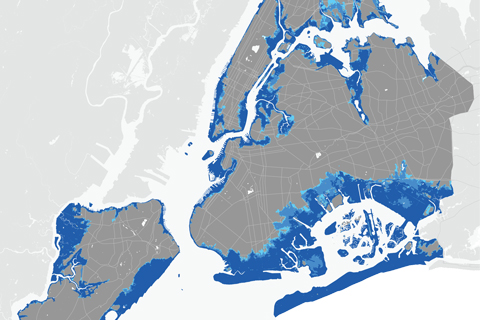
If mid-century projections of sea level rise prove true for New York City, four times as many people may be living in the 100-year floodplain than were previously estimated based only on observed changes.
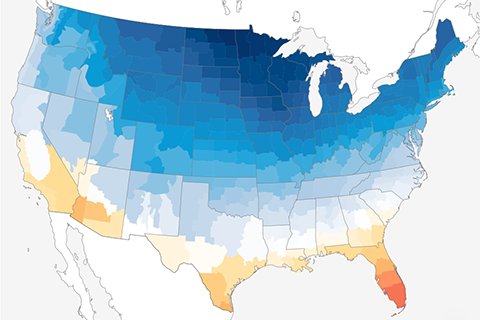
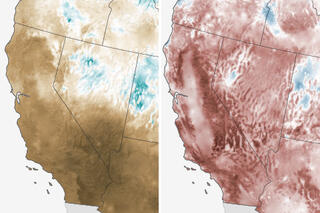
Average temperatures across the contiguous United States in February ranged from frigid to balmy.
