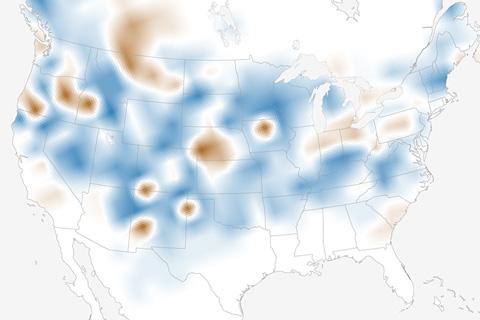
Just for fun, we asked the experts at the Rutgers Snow Lab to show us what their data (based on NOAA satellite images) had to say about whether the number of snow-covered days during the week of Christmas has changed at all across the U.S. in the past 50 years.

For those of you dreaming of a white Christmas, NOAA has a map showing the historic probability of your dream coming true.
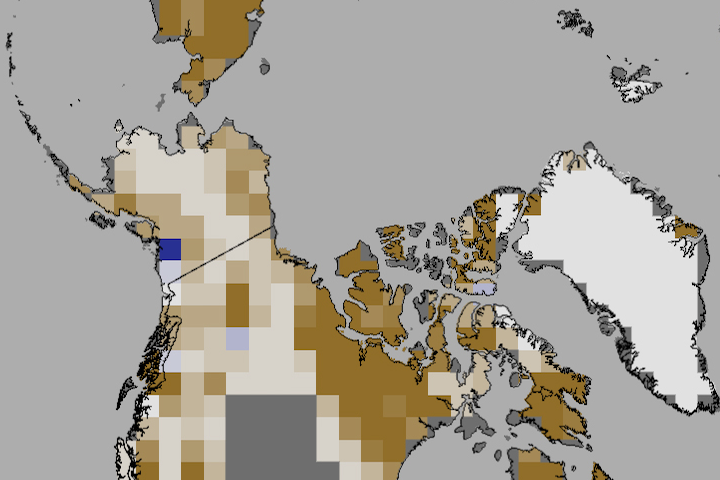
In June 2012, snow cover extent over Eurasia and North America hit a new record low. It is the third time in five years that North America has set a new record low, and the fifth year in a row that Eurasia has. The rate of snow cover loss over Northern Hemisphere land areas in June between 1979 and 2012 is -17.6% per decade—a faster decline than September sea ice loss over the same period.
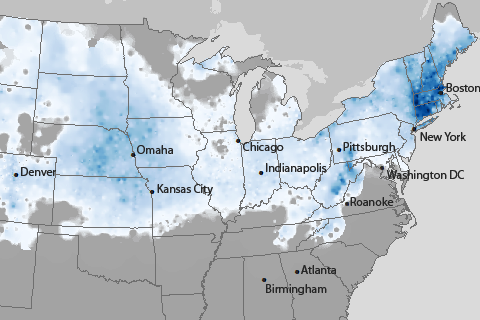
How did this year’s storms compare to the worst in recent history?
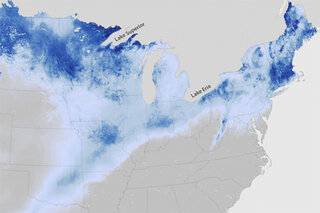
Another Wintry Winter for the Eastern U.S.
February 8, 2011
In many locations, spring snow also melts earlier, reducing summer streamflows.
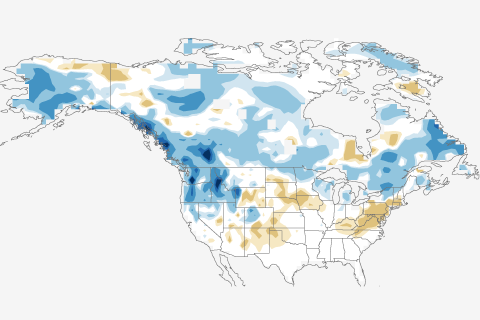
Herein lies the answer to the question you all have been asking: What about snow?
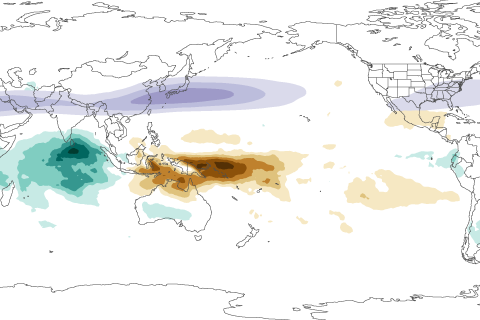
In this installment of our Beyond the Data blog, Carl Schreck talks about how a tropical climate pattern called the MJO left its fingerprints all over California's soaking rains and Boston's recent snowstorm.
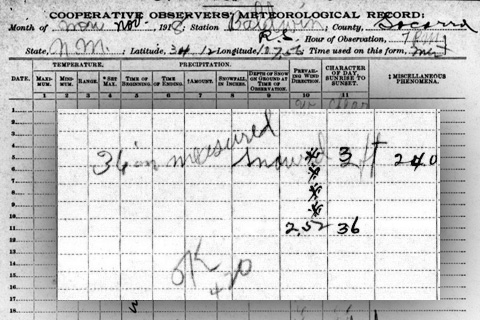
When deciding if a snow event qualifies as a federal disaster, FEMA considers, among other things, how the event compares to previous snowstorms in the historical record. After spending a week going through those records, NECI's Deke Arndt talks about why snow can be the most difficult kid in the climate schoolroom.
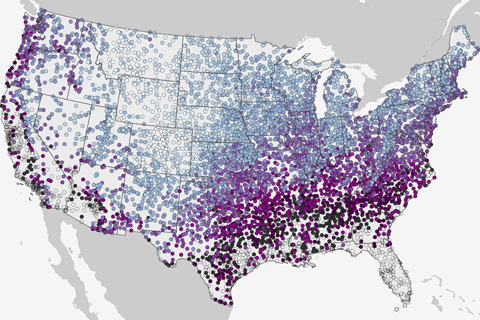
For those who are still waiting for winter's first snow, Deke Arndt blogs about using historical climate data to ballpark when it might arrive.