On the sudden stratospheric warming and polar vortex of early 2021
The POLAR VORTEX is coming!!!!! That’s the ALL CAPS message these days in various news articles thanks due to the sudden stratospheric warming that occurred on January 5, 2021. We’re going to take a deeper look at the polar vortex and possible interactions with our ongoing La Niña. But, to recap previous articles on this blog:
— The Polar Vortex doesn’t just appear randomly. The polar vortexes (more than one!) are a regular feature in the atmosphere, spinning away around the poles in both the Northern and Southern Hemispheres.
— There is the stratospheric polar vortex, which is located in the layer that is 5-30 miles above Earth’s surface and only appears in winter (this is the focus of the Q&A below). Sometimes you might also hear about the tropospheric polar vortex, which is year-round and occupies the lowest layer of the atmosphere that touches the surface.
— Sudden Stratospheric Warmings (SSWs) are occasions in the winter (~6 times per decade), when the polar stratosphere warms and the winds that normally flow from west to east around the pole weaken dramatically and even reverse direction, corresponding to a breakdown of the polar vortex.
— These SSWs can eventually cause the tropospheric jet stream to weaken, which allows cold air bottled up near the polar cap to escape and expand into the middle latitudes, such as the United States, Europe, and parts of Asia. The impacts on the surface are not guaranteed and they are not necessarily experienced everywhere.
Luckily, a great panel of scientific experts came together to answer our burning questions: Amy Butler at NOAA Chemical Sciences Lab, who has written two guest posts previously, Laura Ciasto at the NOAA Climate Prediction Center(previously blogging on Ultraviolet radiation) and Daniela Domeisen, who researches SSWs and surface impacts at ETH Zurich.
(1) What is going on with the stratospheric polar vortex so far this January?
Ciasto: For the last several weeks, the stratospheric polar vortex has been weakening. What that means is the winds at 10 millibars (that’s the layer of atmosphere about 18 miles above the surface), which normally move from west to east around the pole, began to slow down and temperatures began to warm up. By January 5, the winds actually switched direction and began moving in the opposite direction. The timing of wind reversal is considered the start of the sudden stratospheric warming event. SSWs can come in different shapes and sizes.
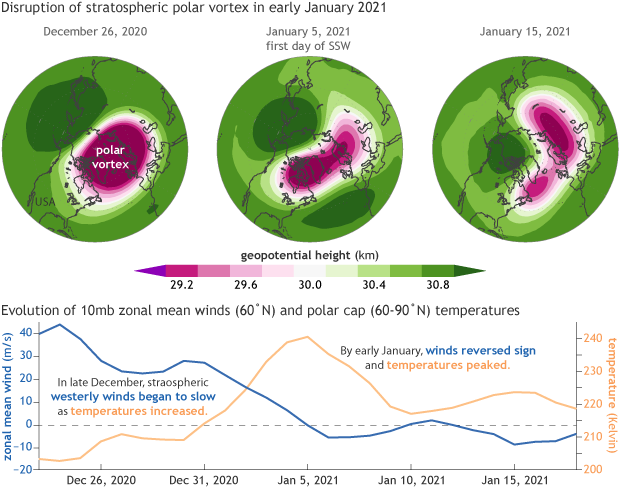
Evolution of the sudden stratospheric warming (SSW) in the stratospheric circulation. Top figures show 10 millibar (mb) geopotential heights for (left) December 26, 2020 as the polar vortex began to weaken, (middle) on January 5, 2021 when the stratospheric winds reversed sign and (right) on January 15, 2021 during the warming event. Bottom figure shows the evolution of the 100mb zonal mean winds (blue line; units in m/s) at 60°N and 10mb polar cap temperatures (red line; units in Kelvin) from December 15, 2020 through January 18, 2021. Figure courtesy of Lara Ciasto (NOAA CPC). Data from NCEP/NCAR Reanalysis.
Butler: While it’s not entirely clear yet what led this SSW to occur, in the weeks leading up to the SSW there was a fairly persistent low pressure weather system over the North Pacific and high pressure weather system over the North Atlantic and Eurasia. This pattern represents a really large (planetary-scale) “atmospheric wave”, which can grow bigger as it extends upward into the stratosphere given the right location and wind conditions. These same weather patterns have been linked to prior SSWs. An extratropical bomb cyclone in the North Pacific just days before the SSW might have reinforced this pattern, but this connection will have to be investigated further.
(2) Some are saying that the current event will lead to “wild winter weather” over the United States, Europe, and parts of Asia. How wild will it get?!
Butler: In general, disruptions of the polar vortex can cause cold air outbreaks over much of Europe, Asia, and the eastern USA. Other regions, like the Canadian Arctic and subtropical Africa and Asia may see much warmer than normal temperatures (Footnote #1). However, there can be a lot of variability from one SSW event to another in terms of who gets hit with the extreme cold and snow that we’ve come to associate with these polar vortex events. [Read about some of Butler's recently published research other weather impacts of polar vortex events.]
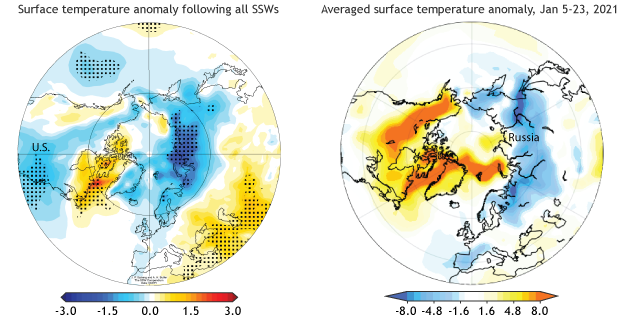
Surface temperature anomalies in degrees Celsius for (left) the 30 days following all identified SSWs in the NCEP-NCAR reanalysis record from 1958-2013. From Butler et al. 2017 and (right) for the period averaged from Jan. 5 to Jan. 23 2021. Figure courtesy of Amy Butler (NOAA CSL) using data from the NCEP/NCAR Renalysis.
The location may depend on where the polar vortex splits or displaces, as well as what other factors, like ENSO, are influencing the weather at the time. Following the recent SSW, there appears to be some clear coupling between the stratosphere and troposphere—the overall temperature anomaly pattern looks very similar to what we have seen following previous SSWs-- but as of the writing of this blog had not yet resulted in extreme cold over some regions like the eastern U.S. This may be because extensive “blocking” over parts of the Canadian Arctic, which means higher-than-average atmospheric pressure in the troposphere, was blocking the flow of colder temperatures into these areas during the first few weeks of January. This blocking may ease up over the next week or two, allowing more cold to be ushered into North America.
Domeisen: After the SSW event, parts of Europe have seen very cold weather in the north and stormy weather in the south; for example, Spain was hit by major snowstorms. Although we haven’t yet been able to attribute the weather events to the stratosphere, some of these impacts may be linked to the stratospheric event. This recent event is, however, not as nice a textbook example as the SSW we had in February 2018, which led to persistent cold weather in northern Europe.
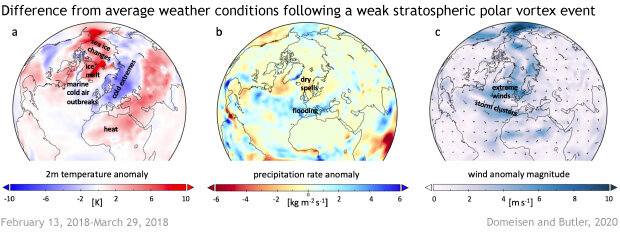
Left figure: 2-meter temperature, Middle figure: precipitation rate, and right figure: surface wind anomalies (arrows indicate the direction and magnitude of the anomaly, shading indicates the magnitude of the anomaly) after weak vortex events. The values are averaged over the 45-day period following a case of an extreme weak vortex event during the period from 13 February 2018 to 29 March 2018 using data from the NCEP/NCAR reanalysis. [from Domeisen and Butler, 2020]. Figure courtesy of Daniela Domeisen (ETH Zurich).
(3) As we’ve reported on this blog, we are currently in a La Niña pattern. What might this mean for the impacts we get with this particular sudden stratospheric warming?
Ciasto: The US can get plenty of attention from the tropics from both ENSO and the Madden-Julian Oscillation (MJO). Over the last few weeks, the MJO has been mostly inactive, so that’s one less tropical influence to consider. La Niña patterns can bring anomalously warm temperatures across the south and cold temperatures over the northern tier of the US. A SSW sometimes can reinforce and expand the pattern, resulting in colder temperatures across the eastern US. However, that doesn’t seem to be happening right now.
Since the beginning of the SSW, surface temperatures have been above average throughout Canada and much of the northern US and below average along the Gulf Coast. Not great for us snow lovers in North America! Because SSWs can come in different shapes and sizes, understanding the influences of these signals, especially when combined other climate phenomena like ENSO and the MJO, is difficult and makes forecasting subseasonal temperature and precipitation impacts challenging. This is why at NOAA’s Climate Prediction Center we take into account many different models and techniques when creating our subseasonal climate outlooks.
L’Heureux: I know I should stay in my lane as an editor, but as an ENSO expert, I’ll throw in my two cents here. In December and so far this January, I’ve seen a very persistent pattern of anomalous ridging (or above-average presssures) over the North Pacific Ocean, north of Hawaii. This is likely the direct result of La Niña. However, the rest of the pattern over North America is a bit of a mess to say the least. We’ve also noticed strong below-average pressure over the Gulf of Alaska and Alaska. This is not a feature that is typical of La Niña, where the pressure anomalies normally set up over western Canada and the northern tier of the U.S. (similar to the PNA pattern). Like Laura wrote, this has led to warmer than expected conditions over much of North America. However, the event is still not over and we could still see some more cold air outbreaks into parts of the U.S. and Europe.
(4) I asked this question of my last expert panel on the Blob, so it only seems fair I pitch it at you all. If you got the Blob, Polar Vortex, and Godzilla El Niño into the ring, which one would win?
Butler: As a stratospheric scientist I’m a bit biased towards the Polar Vortex, but only if we get to change its ring name to Stratospheric Hurricane.
Ciasto: If the ring is in the US, I’d have to say Godzilla El Niño and the Blob would probably team up and beat the Polar Vortex. But I always like to root for the underdog.
Domeisen: I think the Blob and the Godzilla El Niño would fight it out for North America, El Niño would win the tropics and the entire Southern Hemisphere, while the polar vortex will emerge as a clear winner in all competitions in Eurasia.
-----------------
EXTENDED INTERVIEW (read on to learn more!)
(5) A non-meteorologist relative of mine emailed me asking if the polar vortex is split. Can you describe what that means and the possible consequences of a split versus displaced vortex?
Butler: When the polar vortex is being slammed by large atmospheric waves, it tends to either be pushed off the pole, or split into two smaller vortex lobes. Sometimes, it’s displaced first and then splits. So far this year, the polar vortex has shifted off the pole and become very stretched out over the North Atlantic and Europe, though in the lowermost stratosphere some splitting has occurred. In the coming weeks the vortex looks to shift over northern Asia and then possibly become more elongated over North America.
Domeisen: While split and displacement events look very different up in the stratosphere, we don’t fully understand yet what the differences are in their surface impact. Generally, when one of the smaller vortex lobes in a split event moves over a certain region, e.g. North America, this can lead to extreme cold weather in this part, as observed in January 2019.
(6) How well predicted was this sudden stratospheric warming relative to some others? I remember looking at some of the model guidance and it seemed some were hinting at this development fairly early. Can you speculate on some reasons why they may have predicted it?
Ciasto: By mid-December, the dynamical models were predicting a weakening of the stratospheric polar vortex for early January. Several of the models also predicted the brief strengthening of the polar vortex followed by a second weakening that occurred around Jan 10. But it seems that the models had a more difficult time forecasting the spatial features of the warming (i.e. vortex displacement vs splitting in two lobes). This could, in turn, impact the ability of the models to predict SSW-related surface impacts.
Domeisen: It seems that people had a hunch of what would happen as early as the beginning of December: In the SSW competition launched in early December on twitter, where everybody has to guess the timing of the SSW in the upcoming winter, most votes were indeed for early January.
(7) Has global warming influenced sudden stratospheric warmings in either hemisphere or is it projected to?
Butler: For the Northern Hemisphere, the short answer is that there’s been no robust trend in SSWs observed, though there is significant variation from decade to decade, with some periods like the 1990s showing almost no SSWs and others, like the 2000s, showing one almost every year. In the future, climate models do not agree about what will happen in a warmer climate. Some show significant strengthening of the polar vortex while others show weakening.
The differences are likely related to how and where the temperature changes due to increasing greenhouse gas concentrations in a particular model or scenario. For example, the tropical upper troposphere is predicted to become warmer, which will likely enhance the equator-to-pole temperature gradient across the tropopause (the atmospheric layer that separates the troposphere from the stratosphere), which would speed up the polar vortex in both hemispheres. However, enhanced warming of the Arctic surface relative to the middle latitudes reduces the surface temperature gradient and may act on the Northern Hemisphere polar vortex in the opposite direction. Also, the big atmospheric waves that nudge the stratosphere might differ in intensity or frequency in a future climate, which could affect how often SSWs occur.
Domeisen: We can also look at past events: Although we don’t have reliable measurements of the Northern Hemisphere stratosphere before the 1950s (even less so for the Southern Hemisphere), we can estimate the frequency of SSW events for the past decades from their surface impacts. This reconstruction yields that there hasn’t been a trend in SSW frequency over the past centuries, but decadal differences in variability (the dark red line in the Figure below shows the estimate of SSW frequency, the light red line shows the measurements starting in 1979). In particular, the 1990s were characterized by a long absence of SSWs, which turns out to be the longest absence since 1850 – we do not currently know why.
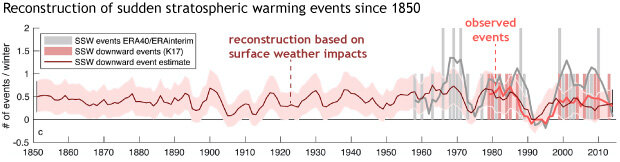
The number of sudden stratospheric warming (SSW) events per winter (gray bars) according to a combination of ERA40 and ERA-interim data (1958–2014) and the number of downward SSW events for 1979–2014 (red bars). The gray and light red lines indicate the smoothed frequency of occurrence for the respective time series (underlying bars). The dark red line indicates an estimate of SSW events with a downward impact, while the shading indicates the uncertainty given by the 95th percentile. Figure from Domeisen, 2019, JGR, courtesy of Daniela Domeisen (ETH Zurich).
FOOTNOTES:
(1) These temperature changes are linked to an equatorward shift of the North Atlantic jet stream and high-latitude blocking, which describes the negative phase of the North Atlantic Oscillation.
Comments
precipitation rate
RE: precipitation rate
Thanks for checking. Here's another example of a precipitation rate figure from NOAA PSL:
https://www.psl.noaa.gov/map/images/rnl/prate_01a.rnl.anim.html
I realize "kilograms per meter squared per second" is a little odd to think about, but it is a "rate" (change in quantity over time). This particular unit is sometimes shown because it's standard output from many of our models and analysis.
RE: RE: precipitation rate
RE: precipitation rate
Polar Vortices
RE: Polar Vortices
Sudden Stratspheric Warming
Impact of ENSO/climate change in mountainous climates
RE: Impact of ENSO/climate change in mountainous climates
Hi Robert,
I do not think we've covered ENSO and mountains specifically. Though this article about snow during La Ninas is the closest https://www.climate.gov/news-features/blogs/enso/what-about-snow-during….
There have been other articles on climate.gov that touch on mountain meteorology though. The first is an article from ouy Beyond the Data blog
https://www.climate.gov/news-features/blogs/beyond-data/highs-and-lows-…
The second is about climate and skiing
https://www.climate.gov/news-features/climate-and/climate-skiing
Atlantic Ocean temps
Absence of SSW's during the 90's
Help me understand
RE: Help me understand
VLF Transmitter Bifurcation of Inner Magnetosphere?
Are other low to mid latitude areas vulnerable to winterstorm?
RE: Are other low to mid latitude areas vulnerable to winter
Pretty much anywhere in the middle latitudes (N. America, Europe, Asia) can be vulnerable to extreme cold air out breaks on occasion! Keep in mind that the intensity and frequency of these outbreaks appears to be dwindling due to climate change, but they still happen and one has to be prepared.
RE: RE: Are other low to mid latitude areas vulnerable to winter
Texas
Add new comment