September 2021 ENSO update: feeling groovy
It’s likely that the tropical Pacific is on the verge of getting into the La Niña groove, and forecasters estimate a 70-80% chance of La Niña this winter. NOAA’s forecast discussion says “the ocean-atmosphere system reflected ENSO-neutral [in August], but is edging toward La Niña.” Let’s dig into that!
The age of Aquarius
First things first: a reminder of why we’re here every month, rain or shine, talking about ENSO (El Niño-Southern Oscillation, the entire El Niño/La Niña system of the tropical Pacific). We do it because when it comes to the global climate, the tropical Pacific has all the influence of Jimi Hendrix playing guitar in the middle of a concert crowd. Sure, those closest by are experiencing the main effects, but the flow of people all around the field gets shifted, too, as people move toward or away from the performance—depending on their individual feelings about electric guitar. ENSO does the same to the global climate.
So, let’s tune in to the sea surface temperatures in the Niño-3.4 region, our primary monitoring index for ENSO.
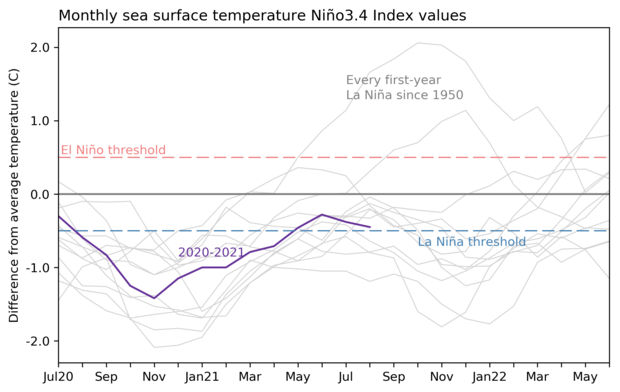
Monthly sea surface temperature anomalies (difference from average) in the Niño 3.4 region of the tropical Pacific for 2020-21 (purple line) and all other years starting from first-year La Niña winters since 1950. Climate.gov graph based on ERSSTv5 temperature data.
The first step on our “Is it La Niña?” flowchart is a one-month average sea surface temperature anomaly in the Niño-3.4 region that is 0.5° C below the long-term average. A couple of definitions: here long-term means 1991–2020, and I’ll use anomaly to describe the difference from the long-term temperature average. The La Niña threshold is an anomaly of -0.5° C.
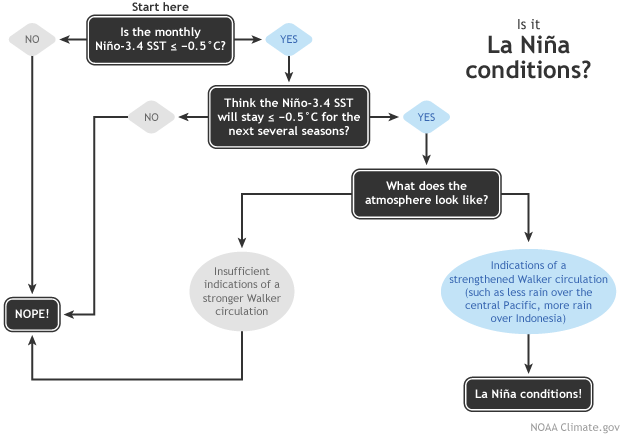
Flowchart showing decision process for determining La Niña conditions. Figure by Fiona Martin, adapted by Climate.gov.
The decision tree doesn’t specify which ocean temperature dataset, and some months—like this one—the various datasets will have different values. While ERSSTv5 says the August anomaly was -0.45° C, which rounds to -0.5° C (at the La Niña threshold), the OISST says the August anomaly was -0.44° C, which rounds to -0.4° C! And there are additional SST datasets too! So have we checked off the first box of the flowchart, or not? Such is the dilemma of the ENSO forecaster.
Fortunately, we don’t have to make decisions based solely on one month of the Niño-3.4 Index. (And yes, of course there’s the atmosphere, but I’ll get to that in a minute.) We also have weekly monitoring of the sea surface temperature. While we definitely do not make decisions based solely on the weekly value, it can provide a clue about the next step on the flowchart—do we expect that monthly anomaly to stay more than 0.5° C below average for the next several seasons? A season here is any three-month period, e.g., September–November.
ENSO is a seasonal pattern, meaning the sea surface temperature anomaly needs to stay in La Niña territory for an extended period, indicating that the ENSO feedback between the ocean and the atmosphere is present. The weekly Niño-3.4 index as of September 1st was about -0.3°C. This suggests that, while we are close to La Niña, we’re still seeing enough wobble in sea surface temperatures that we can’t be sure that La Niña conditions have locked in.
Animation showing sea surface temperature departure from the long-term average from mid-July 2021 to early September. Graphic by climate.gov; data from NOAA’s Environmental Visualization Lab. Description of historical baseline period here.
Good vibes
Speaking of the atmospheric response, let’s take a look at what’s happening above the tropical Pacific. The La Niña atmospheric pattern is a stronger Walker circulation. The Walker circulation is driven by the difference between warm ocean surface in the far western Pacific and Indonesia, which causes warm rising air and storm. When this air gets high up in the atmosphere, it travels eastward across the Pacific (and westward across the Indian Ocean, but that’s not our focus right now). This current of air descends over the cooler water of the central/eastern Pacific and travels back westward near the surface, completing the circulation. La Niña, with its cooler-than-average central/eastern Pacific surface temperature, amps up the Walker circulation.
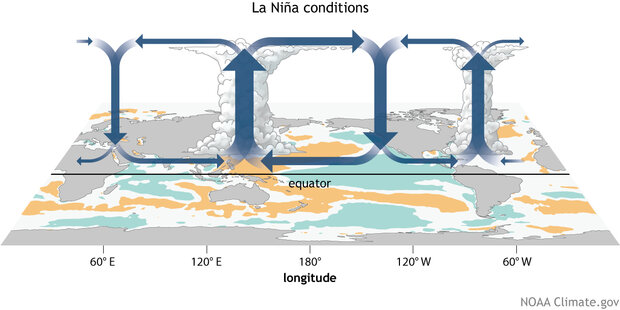
Figure 3: Generalized Walker Circulation (December-February) anomaly during La Niña events, overlaid on map of average sea surface temperature anomalies. Anomalous ocean cooling (blue-green) in the central and eastern Pacific Ocean and warming over the western Pacific Ocean enhance the rising branch of the Walker circulation over the Maritime Continent and the sinking branch over the eastern Pacific Ocean. Enhanced rising motion is also observed over northern South America, while anomalous sinking motion is found over eastern Africa. NOAA Climate.gov drawing by Fiona Martin.
In August, there were some indications that the Walker circulation was strengthening, including regions of stronger-than-average winds, both low-level and upper-level, over the western tropical Pacific, more clouds and rain than average over Indonesia, and drier conditions near the Date Line. This supports the forecasters’ consensus that the tropical Pacific is edging towards La Niña.
Far out
Because we are so close to La Niña right now, it’s looking more probable that La Niña will lock in by this winter. Besides the historical tendency for second-year La Niñas, many climate models are predicting La Niña conditions to develop shortly, though they somewhat differ on whether an event will begin this coming month or in October.
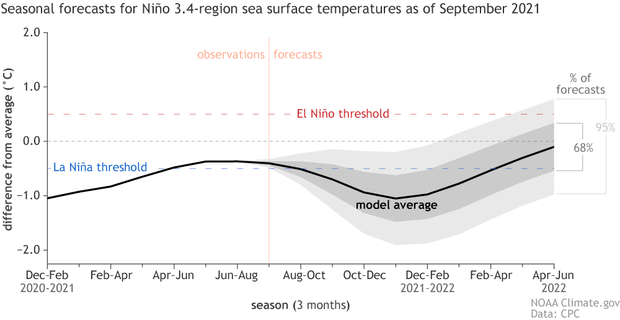
Climate model forecasts for the Niño3.4 Index. Dynamical model data (black line) from the North American Multi-Model Ensemble (NMME): darker gray envelope shows the range of 68% of all model forecasts; lighter gray shows the range of 95% of all model forecasts. NOAA Climate.gov image from University of Miami data.
As far as strength goes, the most likely scenario is a weak La Niña, with the peak Niño-3.4 anomaly between -0.5° C and -0.9° C, though there is a roughly 1 in 3 chance it will be stronger. Along with the climate model predictions, most of which are around this range, physical indicators of a strong La Niña (peak Niño-3.4 Index cooler than -1.5° C) like a very large amount of cooler-than-average water under the surface of the tropical Pacific, are lacking, so there’s a less than 10% chance of that happening.
Hang loose
La Niña tends to strengthen the Atlantic hurricane season and diminish the eastern Pacific hurricane season, both of which impacts have been very much in evidence so far this year. And, of course, La Niña affects U.S. winter weather, although a weaker La Niña means it may not dominate the winter. We’ll have to wait and see what the forecasters at NOAA’s Climate Prediction Center think when they issue their winter weather outlook next month.
Many thanks to Tom and Nat for filling in for me the past couple of months! It was fun to work on tornados and the North American Monsoon for a little while, but I’m happy to be back and keeping you updated on all things ENSO.
Comments
La Nina
Submitted by Bob on Fri, 2021-09-10 00:18
The australian BOM is preficting ENSO neutral through winter. Lets see who wins
RE: La Nina
Submitted by Nathaniel.Johnson on
Note that the BoM uses different criteria for declaring El Nino and La Nina than NOAA, including a lower Nino-3 or Nino-3.4 threshold (0.8C below average instead of 0.5C below average). Therefore, it is possible both NOAA and BoM are right: the event might meet NOAA's criteria without meeting BoM's criteria.
RE: RE: La Nina
submitted by Bob on
Thanks for that inforation
ENSO
Wishing this lanina scenario doesn't happen
Chances of strong Lanina
Submitted by Mohammad Alkhateeb on
Thank you very much for the updates . There are small chances ( roughly 1/3 =33.3%) of strong lanina happening according to the statistical models and that is clear, but the seasonal forecast 95% confidence interval shows that the chances expand between October-January that the enso peak anomalies go below -1 in the attached figure and persistently for like 8 weeks period. what are the chances that we get consecutive laninas (>4 Ninas) like what happened between 1970-1976, there were several small to strong successive lanina's that tookplace, and i am not certain what could explain that succession in the 1970's. The tropical region had been affected by many antarctic cold blasts particulary Brazil and Argentina and even parts of south Australia had cold blasts, any interacted effects for those on underwater cooling?
Thank you again.
BR
Mohamed
RE: Chances of strong Lanina
You're right that 3-yr La Ninas have occurred in the recent past (1973-1976, 1998-2001), so we can't rule it out! However, I note that the dynamical models are consistent in terminating this event by next spring. Of course, we have seen the dynamical models miss at these long lead times before, so we need to stay alert.
RE: RE: Chances of strong Lanina
Thank you Nathaniel.Johnson for your kind reply . I have a hunch based on intuition/guess that the next month's update will differ dramatically . The models used in the above report do Not account for the impact from volcanic forcing, do they? I am not sure the estimates from the element models do incorporate variables like the volcanic forcing and other sources of variability in the underwater temperatures . There have been several substantive equatorial volcanic eruptions that took-place near the equator the last 12 months, volcanic eruptions that happen near the equator have instant and longer-lived inpact on the stratospheric temperatures as such the circulation , to name some of the eruptions : Mount Nyiragongo volcanic eruption On Saturday 22 May 2021 Mount Nyiragongo volcano, also in South America In April 2021 , as well 18 paroxysmal eruptions in Etna Volcano Of Italy since February, 2021 , plus several many other eruptions that had reached stratospheric or near stratospheric altitudes , these eruptions combined MAY have some influence on the dynamics and I am Not a climatologist but also volcanic eruptions on the eastern sides of continental land that happened last 12 months may have another Bill to pay if we add up their effect or interact it with these models . In short: I am not sure the models in use for those propensity estimates of the lanina and its magnitudes do account for other sources of noise,maybe they do . That is why I have such intuition we may face stronger than predicted Lanina .
Thank you again for your kind reply ,
Mohammad
RE: RE: RE: Chances of strong Lanina
Thank you, Mohammad, for sharing your thoughts. I agree that volcanic eruptions potentially could impact ENSO - the science is not settled, but Tom covered this topic last year. However, I am not sure that the level of volcanic forcing this year is enough to tip the scales one way or the other. If we had a situation equivalent to, say, the Pinatubo eruption of 1991, then there certainly would be a strong pull to incorporate that forcing into our ENSO forecasts and to study its effects on our seasonal forecasts.
RE: RE: RE: RE: Chances of strong Lanina
Thank you for Tom's article it shed a lots of light and untangled many intertwines here .
Accept my wishes for you with a great day.
Mohamed
Emiley
A late one more note to Emiy : Thanks for putting things in simple contexts, you always make things straightforward and clear .
BR
Mohammad
Rain Please
Which one of those squiggly lines is our "wet" La Nina that we had in California a few years back? Can we get into that groove please? ;-)
RE: Rain Please
2010/2011 and 2016/2017 were very wet la nina years. One of those years might have broken a record or two
CFSv2 and NMME Ensemble Nino 3.4 models
Both the CFSv2 and NMME plot models show temps in the Nino 3.4 region bottoming out around - 1.5 degrees. Are we expecting a moderate La Nina or still a weak one? I would rather have a weak one.
RE: CFSv2 and NMME Ensemble Nino 3.4 models
The latest ENSO strength outlook continues to indicate a moderate probability (~35%) that the peak Nino-3.4 index will fall below -1.0C and a low probability (~10%) that it will fall below -1.5C. Those strength outlooks incorporate all available guidance when the forecast is made in early September, so they do not rely on a single or even a small number of factors. I assume that the NMME value you note includes the NASA GEOS-S2S model, which has been notably biased cold for this event, and so forecasters have been discounting its influence. The corrected NMME average values without the NASA model from early September are closer to -1C, and they won't be updated again until early October. The latest CFSv2 forecasts certainly are interesting and are consistent with what you describe, but they curiously show a rapid cooling in September that we have yet to see. Therefore, I would not base expectations on the CFSv2 alone, but it is something that forecasters will keep an eye on. The bottom line is that a weak-to-moderate event seems most likely, and a strong La Nina is unlikely. It's too early to distinguish whether it will be weak or moderate, but hopefully we'll have a better handle on intensity in October.
RE: RE: CFSv2 and NMME Ensemble Nino 3.4 models
Thank You Nathaniel
Thanks + can we sign up for updates?
This was excellent! Thanks.
Is there an email update list for ENSO?
RE: Thanks + can we sign up for updates?
There are couple ways to make sure you don't miss updates from the ENSO blog. You can follow Climate.gov on social media, sign up for our weekly newsletter, or use our RSS feed. The social media and newsletter details are in our site footer. The RSS feed can be found at https://www.climate.gov/news-features Look below and to the right of the main content area.
Later this fall, we will be launching a new version of Climate.gov that will offer more customized RSS feeds. You'll be able to follow just the ENSO blog if you want.
Finally, you can just have your calendar remind you to visit Climate.gov on the second Thursday each month, which is when the ENSO forecast updates come out.
La Nina Atmospheric Response
I have a question I hope does not take too much to answer. To be declared a La Nina, the negative SSTs in the Nino 3.4 region must be present for three consecutive months.
What that the atmospheric response to a La Nina state? Does the response and its effect on our weather start to occur quickly? Is it measurable through SOI?
Comments have been disabled on this article