May 2015 ENSO Forecast: Will this El Niño be an overachiever, or peaked-in-high-school?
There’s a 90% chance that the current El Niño will continue through the summer, and forecasters estimate the chance that it will continue through the end of 2015 at greater than 80%. This is a pretty confident forecast. What are the forecasters looking at that gives them such confidence?
Warm and getting warmer
Sea surface temperatures in the equatorial Pacific remained substantially above average during April. Also, there is still a lot of warmer-than-average water below the surface in the upper 300 meters of the ocean, helping to ensure that the above-average sea surface temperatures will continue for at least the next few months.

Sea surface temperature departures from average in degrees Celsius during the week of May 6, 2015. Figure from CPC.
The atmospheric response to the warmer waters in the equatorial Pacific that we began to see in February strengthened through March and April: the Trade winds are more westerly than average, upper-level winds are weaker than average, and more rain was present in the central equatorial Pacific. These are all signs of the weakened Walker Circulation, present during El Niño events, and act to reinforce El Niño events.
This consistent atmospheric coupling is a change from the pattern we saw throughout 2014, when conditions changed from week-to-week. With a climate phenomenon like the El Niño/Southern Oscillation (ENSO), we expect to see more of a persistent pattern. (This doesn’t mean that the El Niño atmospheric conditions are always present every week, but that they are on average over the season.)
Conditions look good, but what’s behind that confident forecast?
Nearly all computer model forecasts predict a continuation of the warmer-than-average sea surface temperatures in the Niño3.4 region through the end of 2015. There is a lot of agreement among the models that the SSTs will remain warm, and most models are forecasting SSTs more than 0.5°C above average through the October-December period. This agreement in forecasts, in combination with an ongoing consistent atmospheric response, is a large contributor to the high probability that this El Niño will continue through the fall.
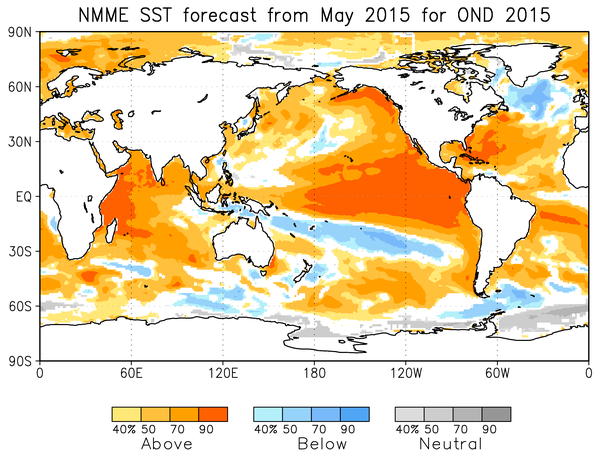
Probabilistic sea surface temperature forecast from the North American Multi-Model Ensemble, made early May 2015, for the October-November-December 2015 average. Forecast is expressed as percent likelihood for each of three categories: Above normal, below normal, and near normal. Figure from CPC.
As far as how strong this El Niño will ultimately be, it’s difficult to say. There is a fair amount of variation in the forecasts for the Niño3.4 region. The statistical models, which predict how current conditions are likely to change by applying statistics to historical conditions, are generally on the lower side of the forecast envelope, around 0.5°C – 1°C, the range of a “weak” event.
Many of the dynamical models, which use physical equations to predict how current conditions will evolve, have Niño3.4 Index forecasts of warmer than 1.5°C, our threshold for “strong” events. Based on past model runs, the bias-corrected NMME dynamical model forecasts made in early May for the October-December period have a typical error of about 0.6°C, meaning, according to this set of models, there’s a 2-in-3 chance that the average temperature in the Niño3.4 region will be in the range of 2.2°C +/- 0.6°C—i.e., between 1.6°C and 2.8°C. *
As Michelle discussed in her last post, models – both dynamical and statistical – tend to have a harder time making successful forecasts during the spring as well. Also, El Niño events typically peak in the early winter, which is still six months away. These factors combine to make it difficult to predict the peak strength of this El Niño. It’s likely that we’ll have a clearer picture of the potential strength in the next month or so. For reference, the potential strength of the strong 1997-1998 El Niño didn’t become apparent, and wasn’t formally mentioned by CPC, until July of 1997 (Barnston et al. 1999).
A special snowflake
Speaking of typical events, though – this is not one of them. As you can see below, it is unusual for sea surface temperatures in the Niño3.4 region to start off warm in the winter and then continue to be warm through the spring and summer. In the 60-year record, only one El Niño event, in 1986-1987, had similar behavior. The evolution and strength of this event might be a little easier to predict if it were starting at a more typical time of year.

Sixteen El Nino events, 1952 - present, with 2014-2015 in red. Average is shown in black. 1997-98 and 1986-87 are yellow and blue, respectively. Figure by Climate.gov from CPC data.
OK, but what’s going to happen??
The most substantial US temperature and rain impacts from El Niño occur during winter. Right now, it’s too early to forecast with much confidence the effect this El Niño may have on the US next winter. (Although the good chance that this El Niño will last into winter does tilt the odds towards the expected temperature and precipitation impacts.)
The Australian Bureau of Meteorology has just raised their event tracker to “El Niño” status, the equivalent of issuing an El Niño Advisory for us. (They have slightly different thresholds for declaring the onset of El Niño.) El Niño events are linked to increased drought and heat waves in Australia, especially during their winter (our summer), so they monitor its evolution closely. If you’re interested in the Australian perspective on ENSO, check out this great post authored by Andrew Watkins of the BOM.
Also, since it’s very likely that this event will continue through the summer, we may see some effects on the tropical cyclone seasons. The western Pacific tropical cyclone season is off to a roaring start, with seven named storms so far (the average is two!), which is likely linked to the warm Pacific waters. Keep your eye out for the NOAA hurricane forecast (issued this year on May 27) for potential effects of an ongoing El Niño.
Barnston, A. G., M. H. Glantz, and Y. He, 1999: Predictive skill of statistical and dynamical climate models in SST forecasts during the 1997/98 El Nino episode and the 1998 La Nina onset. Bull. Amer. Meteor. Soc., 80, 217-243.
*This is based on the Root-Mean-Square Error (RMSE), calculated from 32 years of past forecasts made in early May for the October-December average from the North American Multi-Model Ensemble.
Comments
El Nino and California
RE: El Nino and California
RE: El Nino and California
El Nino Impact on Northern Sierras
So glad I found this blog
Suggestion
RE: Suggestion
Although this is not a notification or RSS feed, it might still help you. The following two web sites give El Nino information, updated once or twice a month:
http://www.cpc.ncep.noaa.gov/products/analysis_monitoring/enso_advisory… is updated the morning of the 2nd Thursday of each month.
http://iri.columbia.edu/our-expertise/climate/forecasts/enso/current/?e… is updated at same time as the above site, and also on the 3rd Thursday of the month (most often in the afternoon).
The second site above has branches into various other aspects of El Nino and La Nina, some giving meaty technical information, which I don't know would please you or turn you off.
Crazy fingers
RE: Crazy fingers
We apologize for using "NJD" instead of "NDJ" in the graphic. Good eye! I hope you got the general idea of the piece despite that error.
how is the 90% chance derived?
RE: how is the 90% chance derived?
Very good question. It is not based just on the IRI/CPC forecast plume. There are 11 human forecasters involved in the development of the probabilities. These forecasters inspect the plume, but also look at a large set of other inputs, some of which are current observations and their recent trends, and some of which are details of the forecasts of some of the models on the plume. These details include, for example, the spread of the model's ensemble members, which is related to the predictive uncertainty. The plume shows the mean forecasts of each model, but does not show the spread of the individual dynamical models' forecasts. Human judgement and experience also comes into play in each forecaster's vote on the probabilities. It is an interesting issue whether this human element improves the value of the forecasts, or if the set of the models' objective forecasts would be just as good, or even better. Some of the 11 forecasters have been around for decades and have a ton of experience with ENSO, while others are earlier in their career. Each person undoubtedly weights things a bit differently, and it is hoped that 11 forecasters is enough for some of these biases to offset one another. The probabilities based on the plume alone can be found in one of the graphs on an IRI web site: http://iri.columbia.edu/our-expertise/climate/forecasts/enso/current/ The plume-based probabilities are formed not just by counting the proportion of models forecasting each category (La Nina, neutral, El Nino), but are based on the average numerical forecast among all models, combined with an uncertainty distribution (Gaussian) derived from an estimate of the historical skill of the set of models over a a 30 or greater year period.
Equatorial SOI
RE: Equatorial SOI
CPC updates the equatorial SOI on a monthly basis. The April value was updated around May 5th, and the May value will be updated around June 5th.
ENSO and Indian monsoon
RE: ENSO and Indian monsoon
The link between El Nino and the Indian summer monsoon was established a long time ago, with El Nino favoring a poor monsoon. CPC is not currently doing much additional work on this relationship, but I'd assume other organizations, especially in India are. For 2015, the IMD issued the following press release on April 22/
http://www.imd.gov.in/section/nhac/dynamic/eng_lrf1.pdf
Labrador Straights
RE: Labrador Straights
I"m not aware of any relationship between North Atlantic SST anomalies and the strength of El Nino. I'd think that the North Atlantic anomalies are more directly related to the North Atlantic Oscillation (NAO) or the Atlantic Meridional Oscillation (AMO).
1997 ENSO
RE: 1997 ENSO
The Climate Assessment for 1997, available on the Climate Prediction Center web site, might have some of the information that you're seeking.
http://www.cpc.ncep.noaa.gov/products/assessments/assess_97/
You can also create your own seasonal temperature and precipitation anomaly maps from the Earth System Research Lab's Physical Sciences Division:
http://www.esrl.noaa.gov/psd/data/usclimdivs/
Historical ENSO Precedence
Galapagos rainfall outlook
RE: Galapagos rainfall outlook
If the El Nino is on the stronger side then it is certainly likely that the Galapagos will experience increased rainfall. However, at this time, it's a bit early to say, so I would recommend monitoring future ENSO updates. In general, the closer we get to November/December, the better the predictions will be. In the absence of other information, I like to point folks to "climatology" (the average) which is presented here:
http://www.cpc.ncep.noaa.gov/products/precip/CWlink/climatology/Global-…
Central and South America
RE: Central and South America
At this point we are not clear on the strength of this event, but future ENSO updates will fine tune and revise our estimate. Keep in mind that one of the trickiest parts of ENSO forecasting is predicting intensity. I would also recommend reviewing the discussions put out by ENFEN which are high quality and focus on interests closer to S. America. http://www.senamhi.gob.pe/?p=0812
El Nino
Add new comment