December 2023 El Niño update: adventure!
El Niño is zipping along in the tropical Pacific. There’s a 54% chance that this El Niño event will end up “historically strong” (more details below), potentially ranking in the top 5 on record. Looking ahead, it’s likely that El Niño will end and neutral conditions return by April–June.
Sail across the Pacific
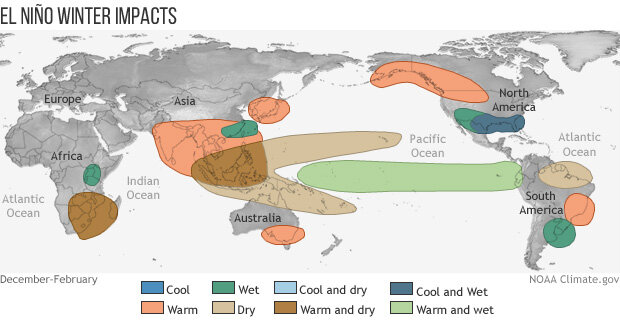
El Niño is associated with specific changes to weather and climate around the world, and the stronger an El Niño, the more likely we are to see those impacts. Of course, nothing is ever guaranteed when it comes to our complex Earth system, and the unpredictable effect of chaos may interrupt the expected impacts. For an excellent, in-depth explanation of why a strong El Niño provides the best information for making seasonal predictions, and yet weather can still upend those predictions, check out Nat’s recent post.
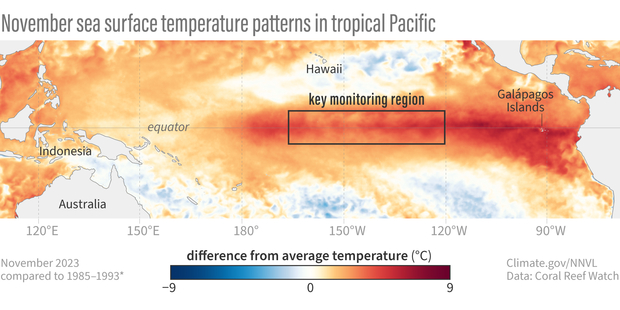
Map of sea surface temperature in the Pacific Ocean compared to the long-term average in November 2023. The waters in the key monitoring region, which scientists call "the Niño-3.4 region," are much warmer than average (red), illustrating the strong El Niño. NOAA Climate.gov, based on Coral Reef Watch maps available from NOAA View.
Our primary metric for the strength of an ENSO event (ENSO = El Niño/Southern Oscillation, the whole El Niño and La Niña system) is the three-month-average temperature of the central tropical Pacific Ocean, specifically in the Niño-3.4 region. The temperature anomaly—the difference from the long-term average, where long-term is currently 1991–2020—in this region is called the Oceanic Niño Index (ONI). We use a three-month average because ENSO is a seasonal phenomenon, meaning it persists for at least several months. We don’t have official strength definitions, but, unofficially, an ONI anomaly of 1.5 °C or warmer is considered a strong El Niño, with 2.0 °C the threshold for “very strong” or “historically strong.”
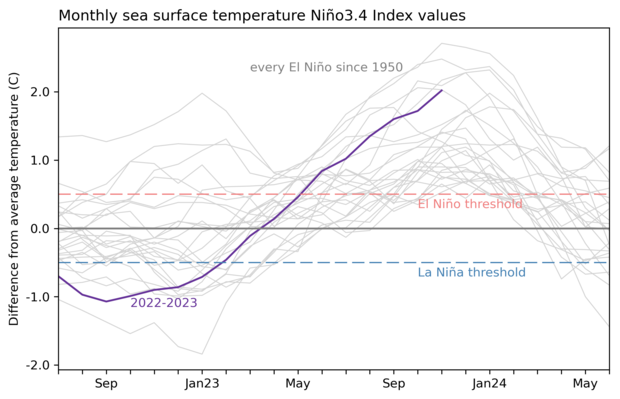
The most recent ONI anomaly, for September–November, was 1.8 °C. November, what I’m showing here in this graph, was 2.0 °C. Many of our computer models predict that it will hang out at or above 2.0 °C long enough to achieve “historically strong” status.
The El Niño events in our record (starting in 1950) with the largest Oceanic Niño Index values are 1972–73 (2.1 °C), 1982–83 (2.2 °C), 1997–98 (2.4 °C), and 2015–16 (2.6 °C). Maybe you’re wondering if the fact that those numbers are in increasing order means that El Niño is getting stronger overall? It probably is not. First, I’ve only picked out the very strongest El Niño winters from the 25 in our record, and there are plenty of weaker events sprinkled in. Also, it’s very unlikely that this event will top 2.5 °C, which would break the pattern.
Instead, the gradual rise in the strongest ONI anomalies is more likely a sign that that some influence from global warming remains in the Oceanic Niño Index, even though we try to remove it by using a rolling 30-year period as our long-term average. For more on this complication, as well as a possible solution, check out Michelle’s post “Is ENSO running a fever, or is it global warming?” She also has a new paper, written with colleagues at the Bureau of Meteorology in Australia, that gives details on an alternative ENSO index.
Sky dive
El Niño is more than sea surface temperature, though. The atmospheric component is just as important, as the atmospheric circulation above the tropical Pacific—the Walker circulation—responds to the changes in the ocean surface temperature and helps to reinforce them. This atmosphere-ocean coupling is critical to ENSO. In the case of El Niño, the warmer-than-average central and/or eastern tropical Pacific leads to more rising air and storms over that region, less over Indonesia, and weaker-than-average upper-level winds and near-surface winds (the trade winds). Overall, this means a weaker Walker circulation.
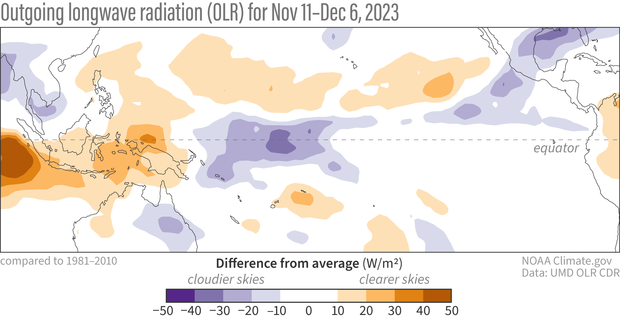
Outgoing long-wave radiation anomaly from November 11 - December 6, 2023. Regions with more clouds and rain than average are shown in blue; areas with fewer clouds and less rain are shown in orange. Climate.gov image from CPC data.
So how is the atmosphere looking, with our current strong, possibly on its way to very strong, El Niño? Looking at the map above, we see a pretty clear signal over the past 30 days of more clouds over the central Pacific (purple, showing that less surface radiation is escaping to space, because it’s being blocked by clouds) and less over Indonesia (orange, where more radiation is making it to the satellites, because there are fewer clouds).
There are a few other ways of measuring the atmospheric response. The Southern Oscillation Index compares the surface pressure in Tahiti to that in Darwin, Australia. When the pressure is lower than average in Tahiti and higher than average in Darwin (a negative index), it is an indication that the Walker circulation is weakened. In November, this index was -0.8.
The Equatorial Southern Oscillation Index (SOI) is another measure of pressure patterns across the tropical Pacific, specifically the average over the western Pacific versus the average over the eastern Pacific. As with the original Southern Oscillation Index, a negative Equatorial SOI shows that the Walker circulation is weaker than average. November 2023 was -1.3. For context, this means the atmospheric signal is approximately in the top third of all El Niño events for this time of year.
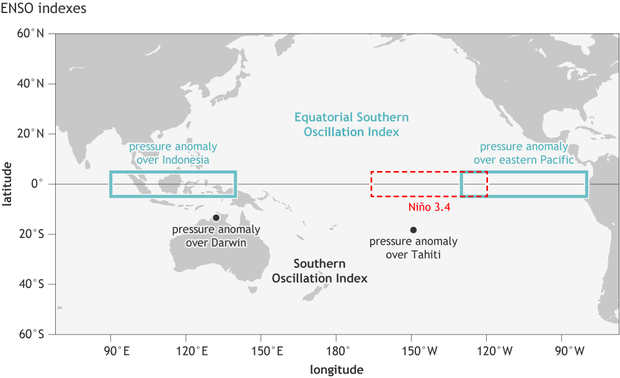
Location of the stations used for the Southern Oscillation Index (Tahiti and Darwin, black dots), the Equatorial Southern Oscillation Index (eastern equatorial Pacific and Indonesia regions, outlined in blue-green), and the Niño3.4 region in the east-central tropical Pacific Ocean for sea surface temperature (red dashed line). NOAA Climate.gov image by Fiona Martin.
Why do we have two indexes that sound like they measure the same thing? The Southern Oscillation Index extends back to 1866, but only measures the pressure at two specific stations, meaning it is more susceptible to short-term weather fluctuations. The Equatorial SOI record starts in 1950, same as our well-observed sea surface temperature record, and measures the average over two very large geographic regions. The larger areas mean that the Equatorial SOI is more resistant to the variability caused by random storms influencing a certain location, etc.
SCUBA
Near the equator, the steady, east-to-west trade winds usually keep warm water piled up in the far western Pacific. When they slow, this warm water can slosh eastward under the surface as a downwelling Kelvin wave.
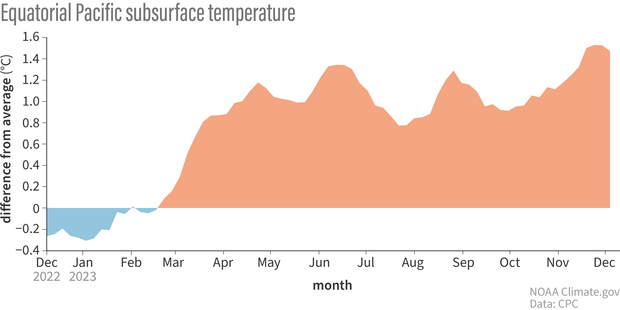
Graph showing the average temperature over the past year of the top 300 m (~1000 ft) of the Pacific Ocean, 180-100°W departure from the long-term (1991–2020) average. Graph by climate.gov from CPC data.
There were some pretty strong “westerly wind bursts,” what we call it when the trade winds slow, during November. These events kicked off a downwelling Kelvin wave, increasing the amount of warm water under the surface of the Pacific. The amount of warm water is still lagging behind what it was during the strongest events on record, as I discussed in October, but it’s a solid source of warm water that will continue to feed the surface over the next few months. For reference: equatorial Pacific subsurface cross-sections from November 1982, 1997, 2015, and 2023.
Bungee jump
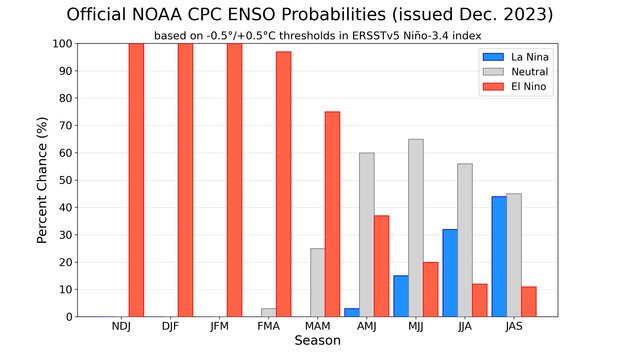
NOAA Climate Prediction Center forecast for each of the three possible ENSO categories for the next 8 overlapping 3-month seasons. Blue bars show the chances of La Niña, gray bars the chances for neutral, and red bars the chances for El Niño. Graph by Michelle L'Heureux.
What goes up must come down! Our current thinking is that neutral conditions are most likely to develop by April–June. Then… what’s that blue bar lurking on the right side?? La Niña and neutral are nearly even odds for July–September, with El Niño a distant third. Most, but not all, of the stronger El Niño events in our historical record were followed by La Niña, so that would not be unusual. We’ll be back with more information when we get back from climbing Everest… I mean, next month!
Comments
Thanks, very interesting!
Thanks, very interesting!
Interesting take
These are all very interesting data points and the author seems to take several liberties in analyzing and interpretation. It overlooks key climate indicators and fails to address the nuanced interactions that actually contribute to the phenomenon. A more comprehensive examination, considering factors like celestial hydroflux dynamics, ionospheric resonance, coupled with the Milankovitch cycles and the Beinhoff scale of temperature variances in the upper equatorial altitudes, would provide a more accurate portrayal of the complex processes involved in a strong, or super strong, El Nino.
huh?
" celestial hydroflux dynamics" and "Beinhoff scale" do not show up in any Google Scholar search
In response to the critique…
In response to the critique of the original analysis, it's imperative to consider the complexities of climatological phenomena through a multifaceted lens. The critique overlooks the fundamental principles of Thermolunar Vibroscopy, a pivotal concept in understanding celestial impacts on climate patterns. Furthermore, the interaction of Photonic Wind Shear with the Earth's Magnetohydrodynamic Permeability offers a substantial explanatory framework for the anomalies observed during strong El Niño events.
Additionally, the critique fails to recognize the significance of Quantum Atmospheric Synchronicity, a leading-edge concept that bridges the gap between microscale meteorological events and macroscale atmospheric dynamics. This is particularly crucial when considering the role of Substratospheric Vapor Induction in global weather patterns.
Moreover, the integration of Gravitational Wave Flux Analysis, a technique that has revolutionized our understanding of cosmic influences on Earth's climate, provides critical insights that should not be dismissed. This methodology, combined with the principles of Neoplasmaic Particle Distribution in the troposphere, offers a more comprehensive understanding of the intricate dynamics at play.
In summary, while the original analysis may seem unconventional, it's grounded in a series of advanced, albeit theoretical, scientific concepts that merit further exploration and validation within the scientific community.
El NIno etc
I've seen through decades (including one time CPC forecaster) too many contradictions between El Nino/La Nina based expectations to take seriously any specific time period. Most explicit example was last year's extreme rain/snow/flooding through California totally inconsistent with designated La Nina period. But right on with El Nino expectations including the southern jet. In my opinion forecasts based on La Nina/El Nino are an exercise in futility and invoked when nothing else to go with. BTW: The mean current atmospheric circulation over US/Canada is not El Nino like and expected southern El Nino jet has yet to appear. Too many external actors at play to overwhelm whatever inherent ENSO might exist.
I think Nat's latest blog…
I think Nat's latest blog post offers some helpful context on ENSO, uncertainty, and seasonal prediction: https://www.climate.gov/news-features/blogs/enso/how-does-el-nino-influence-winter-precipitation-over-united-states
Southern Jet
That southern jet is about to hit in a big way
contradictions
Not being a meteorologist, I can't comment on how much the current circulation over the US and Canada either does or doesn't resemble the signature of El Niño, but I can point out that all of the "typical" and "iconic" patterns that our bloggers talk about as being characteristic of El Niño or La Niña are seasonal averages. We are two weeks into a three-month season, so whatever the current state of the atmosphere, it can't really be considered as evidence for or against a good match with a seasonal-scale pattern.
Your broader point (that the influence of El Niño and La Niña can be and often are overwhelmed by other atmospheric actors), that's a reality our bloggers don't shy away from discussing. NOAA's seasonal forecasts aren't based solely on some kind of ENSO binary, in which forecasters decide in the fall that El Niño is here and then take the rest of the winter off. This blog has always been straightforward about the limits of seasonal forecasts in general, as well as the limits of ENSO as influence on those forecasts.
But over the years, we have also provided plenty of evidence that suggests your statement about "futility" is an exaggeration. Simple statistics show that there are locations in the U.S. that are more likely to have wet/dry/warm/cool winters during El Niño and La Niña. Sure, we can debate exactly how reliable a signal would need to be in order to be useful for a given purpose, but its just not "fair" (i.e. consistent with the data) to say that ENSO has no utility for seasonal forecasting.
Northwest following predictions
Here in the Pacific Northwest the El Nino/ La Nina impact on snow pack seems to hold this time around. I intentionally did not buy a downhill ski pass due to the El Nino prediction (I'm enjoying cross country instead.) However as I recall we had a fair amount of snow in early 2016 even with a strong El Nino. The year prior 2015 had very little snow: it was warm as if the predicted El Nino had come.
Climate anomalies based on…
Climate anomalies based on El Nino is inherently probabilistic. It won't *always* lead to the expected impact (sometimes it will be opposite), but, for some regions, *most of the time* it should lead to the expected impact. Unfortunately the El Nino-less snowfall relationship (in the Pac NW) seems to be one of the more robust signals. https://www.climate.gov/news-features/blogs/snow-pain-snow-gain-how-does-el-nino-affect-snowfall-over-north-america
Present and future
Thanks for the explanation, and for the detailed information about the ongoing El Niño. It will be interesting seeing how it influences the weather here in Oklahoma this winter.
On a different note, I remember reading a previous post about how it is really hard to predict future ENSO conditions in the spring, due to something that its author referred to as the spring predictability barrier. So, does that also influence forecasts made now about ENSO conditions next summer and fall?
Great observation and…
Great observation and absolutely, yes, it affects these predictions which go through the 'spring barrier.' With that said, despite the lower skill/accuracy, there are times when we weight the models a bit more-- and a La Nina following a strong El Nino tends to be one of those times. Still expect those probabilities to shift as we go forward and get more information.
Past behavior influences predictions?
Very interesting answer. It sounds like, when you make ENSO forecasts for the next few months (beyond the "spring barrier"), you incorporate what has happened in the past (when it has been similar to the present) when making your predictions. Is this correct?
Yes, not in isolation, but…
Yes, not in isolation, but it is something many forecasters take note of. That's because there are certain physical processes that are known, and if we see them happening we can become more confident in a transition. For instance: https://www.climate.gov/news-features/blogs/enso/life-and-death-el-niño
Makes sense
What was in that blog post made sense, as does incorporating insights from that El Niño (and previous strong ones) into predictions for when this one will end. I guess we will all now get to see how long it will take that "battery" to fully discharge this time.
Thanks for the answer and the link.
La niña 24-25 and 25-26
After super El niños 72-73 , 82-83 , 97-98 and 15-16 happened 2 or 3 years la niña.
After super El niño 72-73 happened la niña 73-76
After super El niño 82-83 , happened la niña 83-85 with borderline la niña 85-86
After super El niño 97-98 happened la niña 98-01
After super El niño 15-16 happened la niña 16-17 and 17-18.
After super El niño 23-24 , Will happen la niña 24-25 and 25-26
https://psl.noaa.gov/forecasts/seasonal/. This site show another possibility of multi year la niña. (24-25 and 25-26)
ENSO is near neutral
Hi from downunder.
Are you people aware that the Southern Oscillation Index as measured and presented at https://www.longpaddock.qld.gov.au/soi/
is v near neutral. Midday between El Nino and La Nina - thanks for your blog
Thanks for the link. We…
Thanks for the link. We often look at the SOI averaged over a month or more and there can be weather influences. And the November number as noted by Emily was still quite negative.
Comments and Questions
Thanks for a MOST Informative and Educational Article, and NOAA with their probable Three Month Forecast. NOAA was ' Spot On ' with this past Autumns Forecast. I believe their Forecast for ( JFM ) will Pan out also.
Ready for La Nina's return, as we receive more Rains here in the Ohio Valley, but unfortunately more Severe Weather. El Nino use to give Kentucky a Long, Colder and Snowier Winter. Not Anymore.
Questions : Has the Warmer Oceans, the Strong Southeast Ridge and a Strong Polar Vortex eliminated Winter Weather altogether here in the Southeast ? Or is this just a Weather Cycle we have been going through since 2015 ? Or could it be the Solar Cycle we are currently in causing a sudden change in the Climate ?
Thank you in advance,
Stephen S.
I wouldn't give up yet! The…
I wouldn't give up yet! The Southeast can cool down during El Nino (historical snow relationships here)... there are hints that the polar vortex may weaken coming up. Check out the polar vortex blog for more details.
El Nino
So far El Nino has not shown up.in california precipitation
El Niño in Arizona
Nothing in Arizona so far (January 1) is leaving me with doubts about a “strong” El Niño! Normal temps and dry so far!
El Nino
El Nino's effects are most likely to appear from the Jan thru March period. Not that it will happen
Cool oceans
Thank you all again for the great blog post. I'm becoming an armchair meteorologist!
I've also been tracking the giant iceberg, A23a, that just left Antarctica, and I'm wondering: Do these large ice burgs have any impact on the global ocean temperature fluctuations, or are the oceans just too big for these to matter much more than locally?
Anyway, keep up the good work, I'm learning lots, and I really appreciate you all!
El Niño strength and length
Super interesting update ahead of the peak of El Niño, as global climate anomalies are inevitably linked to what ENSO does! So far, global surface air and sea temps are quite elevated in concert with the coming El Niño peak, which is in line with expectations.
However, there are 2 questions I'm sure a few folks interested in the current ENSO phase share:
- After an unexpected three-peat La Niña, that stunningly, did not bring typical cooler ocean & air temps to the planet, what are the probabilistic indicators suggesting this current El Niño phase is likely to exhaust itself by April, potentially transitioning back to (ahem) "cool" La Niña?
- J. Hansen published an interesting note in a mid-December Columbia U piece that touches on ENSO, specifically to dispel the notion the El Niño phase is a causal driver of global warming. By looking strictly at the Nino 3.4 Pacific region Sea Surface Temp anomaly, Hansen and his colleagues maintain the 2016 and this 2024 El Niño are successively weaker events than the massive 1998 event. This is confusing given that many other credible sources say 2016 was / 2024 will be as "big" as 1998. So will 2024 be a big one, or is something else going on here? I.E. is the planet so warm that ENSO as an indicator of "warm" / "cool" years, is out the window, so to speak?
Cheers & Happy New Year to all!
Weather Rock
It's an interesting read and I did learn a few things. Some of the comments were entertaining as well. What I've learned to count on regarding weather forecasting is two things: 1. My window, and 2. My weather rock.
There is always a 100% chance of weather.
El Nino
Any ideas on why El Nino has not resulted in the usual precipitation impacts to California thus far?
El Niño and Central America
I've heard that the rainy season in parts of Central America has not yet ended, even though it's normally over by now (with December also normally dry).
So, does El Niño have any influence on this? If so, what?
El Niño tens to influence…
El Niño tens to influence the climate in Central America more in the summer and fall and is related to drier than average conditions. So it's not impossible that El Nino is playing a part here, but it's not a direct connection to the extended rainy season in Central America.
Web search
Thanks for the response.
That said, I was still really curious about this topic after posting my question, so I did a web search about it (search term: efectos de El Niño en Costa Rica). And, by looking at trustworthy sites, I got an answer:
During El Niño, the trade winds across the Caribbean get stronger, which results in the Caribbean coast getting more rainfall and the Pacific coast being drier. From looking at NOAA satellite images, it looks like this is what is happening, especially in Costa Rica and Panama (as well as Nicaragua).
I know that El Niño is just one factor with this, and that there are others (such as global warming and the MJO) that are probably influencing this. But, I thought it was interesting, so I figured I'd share it with you.
Costa Rica
Thanks for sharing! I am aware that El Nino tends to bring wetter conditions to the southern US and much of Mexico due to the extension of the subtropical jet, and drier conditions to the south (like Costa Rica), but I was not aware of some of the possible more localized impacts over the region.
Costa Rica
2023 had a mixed response not associated only to El Niño. Our Caribbean coast experienced a severe drought, much greater than that one of the Pacific, which is not usual during El Niño, and even less so during a strong El Niño. Certainly, the extraordinary warming in the Caribbean Sea and Atlantic Ocean played a key roles in this year's climate variability.
Hi. Further proof that El…
Hi. Further proof that El Niño is not the only driver of climate variability in this region, look at the SSt in the Caribbean and tropical Atlantic.
Yes, that certainly was a…
Yes, that certainly was a theme during this past Atlantic hurricane season.
Add new comment