Predicting El Niño Then and Now
This is a guest post by Mike McPhaden, who is a Senior Scientist at NOAA’s Pacific Marine Environmental Laboratory in Seattle, Washington, where he’s led development of ocean observing systems for climate, most notably the Tropical Atmosphere Ocean (TAO) array of moored buoys in the Pacific used for ENSO research and forecasting.
There has been a lot of excitement this past year about the development of El Niño-like conditions in the tropical Pacific. From the available observations and current seasonal forecast models, NOAA’s Climate Prediction Center predicted beginning in March 2014 that it was on its way. After many fits and starts that kept us guessing longer than we expected, it finally arrived last month!
Predicting El Niño is serious business because so much is at stake. El Niño and its companion La Niña (which we collectively refer to as El Niño/Southern Oscillation, or ENSO) are drivers of the strongest year-to-year climate fluctuations on the planet. Once underway, they alter patterns of weather variability in many places around the globe, leading to droughts, floods, heat waves, unusual tropical storm activity, and other extreme weather events. For example, on a farm in northeast* Brazil during a recent extended La Niña, drought conditions became severe enough that the only thing left for livestock to eat was cactus (Fig. 1).
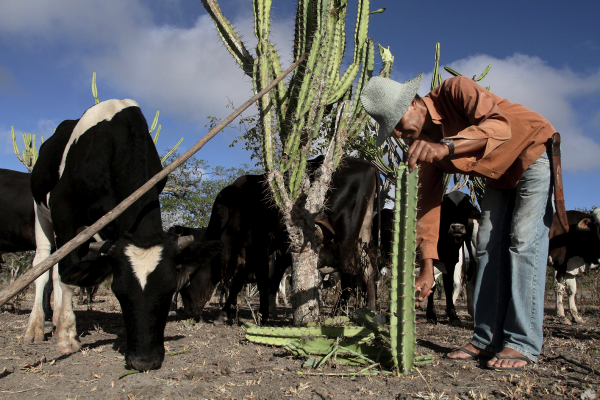
Figure 1. With rangeland decimated by drought, Everaldo dos Santos fed cactus to cattle on April 10, 2012, in Queimadas*, Brazil. Dry conditions struck the region during an extended La Niña, which dominated the tropical Pacific during most of 2011 and through April of 2012. Photo by Adenilson Nunes/Latin Content/Getty Images.
ENSO impacts have real life consequences for agriculture, power generation, fresh water availability, public health, marine ecosystems, and recreational and commercial fish catch and lots of other things that affect people and their economic livelihoods. So it’s no wonder we put a lot of effort into trying to understand and predict El Niño and La Niña.
In fact, our interest in ENSO prediction is not new. The first attempt to forecast an El Niño was made in 1974, just over 40 years ago, by Bill Quinn of Oregon State University and Klaus Wyrtki of the University of Hawaii (McPhaden et al., 2015). They were motivated by the 1972-73 El Niño, which triggered a collapse of the Peruvian anchovy fishery, the largest in the world at the time, with consequences that rippled throughout the global economy (Glantz, 2001). Their hope was to develop a reliable prediction scheme that could be used to anticipate future El Niño events far enough in advance to take preventative actions.
They didn’t have much to work with. There were no satellites observing the ocean at this time, no real-time measurements like we have from moorings, floats, and other observing systems in the ocean today, none of the sophisticated statistical forecasting methodologies we have now, and no comprehensive coupled ocean-atmosphere numerical prediction models. They did have the Southern Oscillation Index (SOI; see Fig. 2), which is a measure of trade wind strength (1).
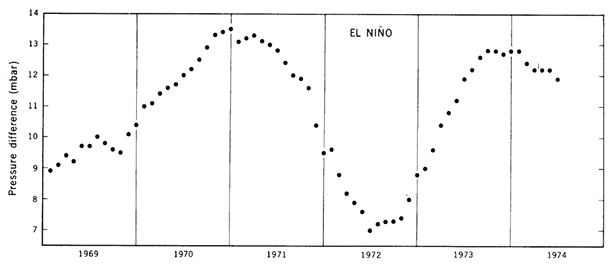
Figure 2. The Southern Oscillation Index (SOI) was the only ENSO-relevant climate indicator at the time of the first El Niño prediction in the middle 1970s. This 1976 graph of the SOI was based on the pressure difference between Easter Island and Darwin, Australia. Today, the index uses standardized pressure differences between Tahiti and Darwin. From Wyrtki, K., et al., 1976: Predicting and observing El Niño. Science, 191, 343-346. Used with permission.
So what did they do? Well, Klaus Wyrtki had just formulated a new theory suggesting that if the trade winds in the central Pacific blew stronger than normal for a year or two, that would set the stage for a subsequent El Niño when the trades eventually weakened (Wyrtki, 1975). Consistent with Wyrtki’s ideas about trade wind precursors, Quinn hypothesized that the signal for El Niño onset would be an SOI that was high for a year or more and began to rapidly fall. The SOI was elevated throughout 1973-74 and began to decrease rapidly in mid-to-late 1974 (Fig. 2).
From these observations, Quinn published the first ever El Niño prediction in 1974:
Based on current indications of these monitoring tools, it appears that we might expect a weak El Niño occurrence in early 1975, unusually heavy central and western equatorial Pacific precipitation in 1975 and below normal precipitation over Indonesia in mid-late 1975 (Quinn 1974).
Quinn presented his El Niño prediction and Wyrtki presented his El Niño theory at a conference in Lake Arrowhead, California in October 1974. The underlying physical principles behind the prediction and theory were the same. So during the conference, Wyrtki and Quinn hatched an idea to test the theory on the assumption that the prediction would prove true.
Wyrtki submitted a proposal to National Science Foundation in late October 1974 for an equatorial Pacific “El Niño Watch Expedition” to determine the origin of anomalously warm surface waters appearing in the eastern Pacific during the onset of El Niño and to determine whether the source of these waters was consistent with the idea of remote wind forcing from the central Pacific.
The proposal was peer reviewed and funded in just six weeks! (2) Two cruises were launched as part of the expedition, the first in February-March 1975 and the second in April-May 1975.
Data collected during the February-March cruise showed an unusual sea surface temperature (SST) warming east of the Galapagos Islands, which generated a lot of excitement! Did they get it right? Unfortunately, no: conditions quickly returned to normal by May during the second cruise of the expedition (Fig. 3). Although no El Niño developed in 1975, Wyrtki and collaborators later published their findings in a paper in Science magazine entitled “Predicting and Observing El Niño” (Wyrtki et al., 1976).
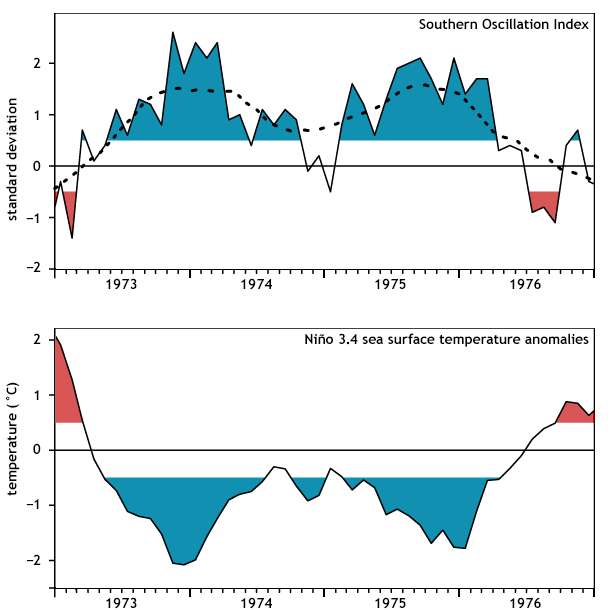
Figure 3. Monthly Niño3.4 SST and Southern Oscillations Index (SOI) for 1973-76, each smoothed with a 5-month running mean filter. The Niño3.4 index is computed as the monthly SST anomaly averaged over the region 5°N-5°S, 120°W-170°W. The SOI is normalized by its standard deviation. Values between ±0.5° on either graph are considered ENSO-neutral. Periods in red represent El Niño conditions and in blue La Niña conditions. Overplotted in the upper panel are 12-month running means of the SOI (dashed line), which Quinn (1974) used to make his prediction. Adapted from McPhaden et al. (2015).
So what happened? In retrospect, we know from a reanalysis (3) of oceanic and atmospheric data covering that time period that the brief warming Wyrtki and collaborators observed was due to transient equatorial Kelvin waves caused by westerly wind bursts (brief but intense spells of winds from the west, in contrast to the usual trade winds from the east) in the western Pacific (Fig. 4).
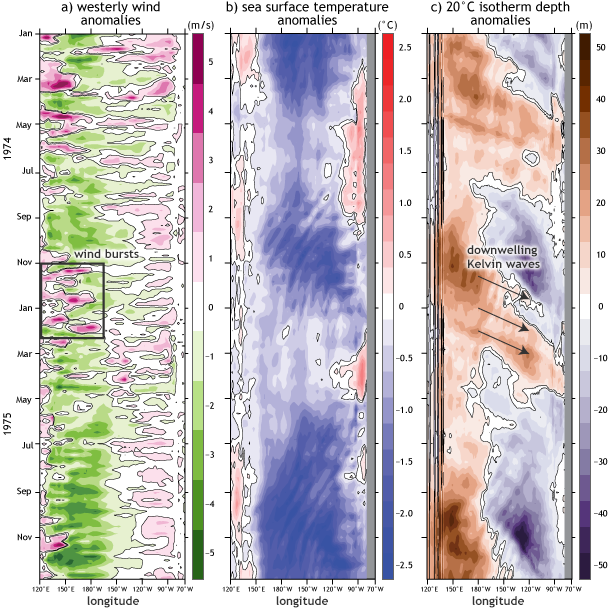
Figure 4. Time series of five-day average climate conditions across the equatorial Pacific (2.5°S–2.5°N) from January 1, 1974–December 31, 1975, compared to the 1961-1990 average: (a) east-west winds, (b) sea surface temperature, and (c) depth of the 20°C isotherm (an indicator of the bottom limit of the well-mixed surface waters of the ocean). Winds are from ERA40 atmospheric reanalysis; SSTs and subsurface temperatures are from ORAS4 ocean reanalysis. Three westerly wind bursts (positive anomalies) are enclosed by the black box in (a). Arrows in (c) indicate three downwelling Kelvin waves evident in the 20°C isotherm depth. From McPhaden et al. (2015).
These Kelvin waves were not the harbinger of an El Niño, as some are, because other factors that would favor El Niño development were missing. One of those missing factors was unusually high temperature in the upper 150 m of the ocean along the equator (in essence, an excess of “heat content”), which generally preconditions the Pacific to subsequent El Niño onset (Meinen and McPhaden, 2000; McPhaden 2012).
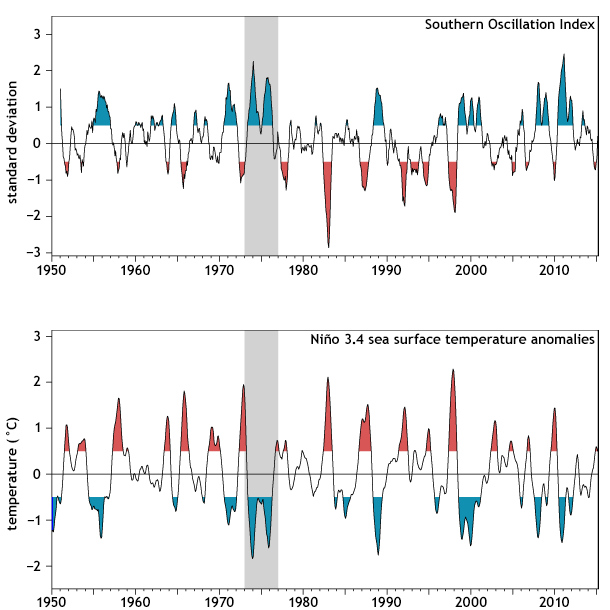
Figure 6. Monthly Niño3.4 SST and Southern Oscillations Index (SOI), each smoothed with a 5-month running mean filter. The Niño3.4 index is computed as the monthly SST anomaly averaged over the region 5°N-5°S, 120°W-170°W. The SOI is normalized by its standard deviation. Values between ±0.5 on either graph are considered ENSO-neutral. Periods in red represent El Niño conditions and in blue, La Niña conditions. The 1973-76 period (enlarged and shown alone in Fig. 3) is shaded with gray. Adapted from McPhaden et al. (2015).
Because heat content had not been sufficiently elevated along the equator in 1974 (Fig. 5), the impulsive westerly wind burst and subsequent Kelvin waves had little long-lasting effect. It turns out that, except for the brief Kelvin-wave induced warming in the eastern Pacific in February-March 1975, the climate system in the tropical Pacific was actually in the depths of a multi-year La Niña (Fig. 6).
It took another 10 years before the first successful El Niño forecast was made for the 1986-87 event (Cane et al., 1986; Barnett et al., 1988). Many groups and organizations have since developed ENSO forecasting methodologies and routinely issue seasonal forecasts. However, even though we now know a lot more than we did back then, have much more data to work with, and have far more technically advanced prediction tools, our forecasts still sometimes miss the mark.
As the baseball player-philosopher Yogi Berra once said, “prediction is easy, unless it’s about the future.” We have made real progress since Wyrtki and Quinn’s first bold prediction 40 years ago, but the problem is far from solved. Look no farther than 2014 to be reminded of that!
Footnotes
(1) The Southern Oscillation Index (SOI) is the normalized difference in sea level pressure between Tahiti, French Polynesia and Darwin, Australia. It is a proxy for the strength of the southeasterly trade winds. Positive values (Tahiti unusually high relative to Darwin) correspond to strong trade winds associated with La Niña and negative values (Tahiti unusually low relative to Darwin) correspond to weak trade winds associated with El Niño.
(2) Most proposals for funding these days are awarded only after a protracted review process that normally takes six months or longer.
(3) A reanalysis means that all of the available data, both from ocean and atmosphere, are collected and assimilated into a dynamical numerical model so that they lead to a set of estimated values at many grid points (intersections of latitude and longitude lines) even though the original data may not be for those exact grid points. Not only is interpolation and extrapolation from the actual available data used to get the values at all of the grid points, but the expected physical relationships within and between different variable fields (such as atmospheric pressure and winds) are taken into account as well. A reanalysis can be thought of as a data reconstruction, when only some of the data are originally available and model dynamics are used to extend their influence to other locations. The SST data during the early decades (such as shown in Fig. 3 and Fig. 6) are generated in this way. While data based on reanalysis are not expected to be as accurate as actually measured data (at least in regions lacking the original measurements), they are usually approximately correct.
*Correction: The location of the photo was first described as "Queimada Vaz" in southern Brazil. A Brazilian reader suggested the location was most likely one of two places called "Queimadas" in eastern Brazil. The text and caption have been updated.
References
Barnett, T., Graham, N., Cane, M., Zebiak, S., Dolan, S., O'Brien, J. and Legler, D., 1988: On the prediction of the El Niño of 1986-1987. Science, 241, 192-196.
Cane, M. A., S. C. Dolan, and S. E. Zebiak, 1986: Experimental forecasts of the 1982/83 El Niño, Nature, 321, 827–832.
Glantz, M. H., 2001: Currents of Change: Impacts of El Niño and La Niña on Climate and Society. Cambridge University Press, Cambridge, UK, 252pp.
McPhaden, M. 2012: A 21st century shift in the relationship between ENSO SST and warm water volume anomalies. Geophys. Res. Lett., 39, doi:10.1029/2012GL051826.
McPhaden, M. J., A. Timmermann, M. J. Widlansky, M. A. Balmaseda and T. N. Stockdale, 2015: The Curious Case of the El Niño that Never Happened: A Perspective from 40 Years of Progress in Climate Research and Forecasting. Bull. Am. Meteorol. Soc., in press.
Meinen, C. S., and M. J. McPhaden, 2000: Observations of warm water volume changes in the equatorial Pacific and their relationship to El Niño and La Niña. J. Climate, 13, 3551-3559.
Quinn, W. H., 1974: NORPAX Highlights, 2 (6), p.2. University of California, San Diego.
Wyrtki, K., 1975: El Niño-The dynamic response of the equatorial Pacific Ocean to atmospheric forcing, J. Phys. Oceanogr., 5, 572–584.
Wyrtki, K., E. Stroup, W. Patzert, R. Williams, and W. Quinn, 1976: Predicting and observing El Niño. Science, 191, 343-346.
Comments
Perfect explanation
ENSO now and then
Picture in Figure 1
RE: Picture in Figure 1
Thanks for the note. We've updated the text and image caption.
Early studies of El Niño in La Habana, Cuba.
El Nino
AI and Machine Learning for El Niño, La Niña prediction
Just wondering if a newer computational and modeling approaches like in AI and ML will cut it for ENSO work.
AI/ML and ENSO prediction
That's a great question. You can be sure that scientists are continuing to test AI/ML methods for ENSO prediction. In fact, this study, which was published a few years ago, shows promising results for predicting ENSO about 18 months into the future using a deep learning neural network method. There also has been promising work on using model analogs from long climate model simulations for ENSO prediction, as shown in this study. So, I think this will remain an active area of research, and hopefully these methods can be used to improve operational ENSO forecasts.
Add new comment