Blogs
The winter average contiguous U.S. temperature was 1.8°F above average, ranking among the warmest third of the record since 1895. In February record-setting precipitation was observed across the mid- and lower-Mississippi Valley, the Midwest and Northern Rockies. During April, the average contiguous U.S. temperature was 48.9°F, 2.2°F below the 20th century average, making it the 13th coldest April on record and the coldest since 1997.
These are some recent statistics provided by NOAA’s climate monitoring program at the National Centers for Environmental Information (NCEI) and are part of the hundreds of climate reports that NCEI has produced in recent decades. Many businesse…
Read article
First off, happy blogiversary to our readers and the ENSO blog team! Hard to believe my first post was four years ago this month. Who would have thought we would still have so much to say about ENSO and the world of climate forecasting? If you’re new to us, or want to revisit old favorites, be sure to check out the index page our amazing editor put together.
Sayonara, sweetheart
Onward! Our next order of business is to bid adieu to La Niña, as the sea surface temperature in the tropical Pacific returned to neutral conditions in April—that is, within 0.5°C of the long-term average.
The temperature of the water below the surface remained above-average, as the large area …
Read article
Average temperature is one of the most used datasets that we provide at the National Centers for Environmental Information (NCEI). The average temperature data for locations on land have been collected for centuries by the military, automated systems at airports and even volunteers. You will often see these numbers on your local newscast and how they compared to normal each day.
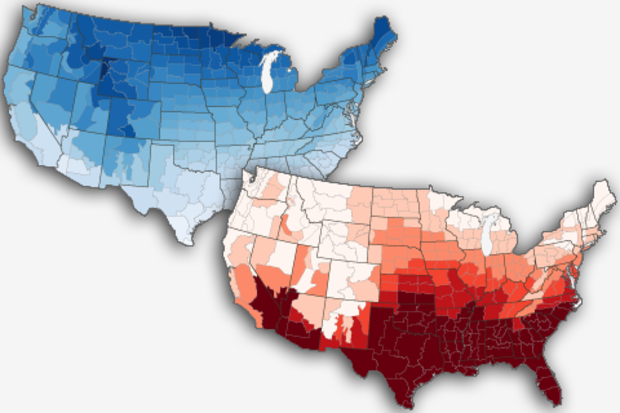
These maps work great for a lot of purposes, including highlighting how a month or season compared to average or how temperatures are changing with time, but sometimes they wash out important details. To capture some of these details, we have a lesser known way to utilize daily average temperature: heating and…
Read article
This is a guest post by Dr. Amy Butler (@DrAHButler) who is a research scientist at the University of Colorado Cooperative Institute for Research in Environmental Sciences (CIRES) and sits within the NOAA Chemical Sciences Division (CSD). She is a returning guest author, and her research focuses on large-scale climate patterns and phenomena, such as the Arctic and Antarctic Oscillations and sudden stratospheric warmings.
Spring hasn’t come quickly enough for many of us who feel battered by the wild winter weather over the past couple of months. Multiple nor’easters brought feet of snow to the northeastern U.S., while severe cold and winter storms punished portions of…
Read article
This week’s Beyond the Data edition looks a little more deeply at NCEI’s monthly U.S. climate report for March.
Cold season blues...or reds, rather
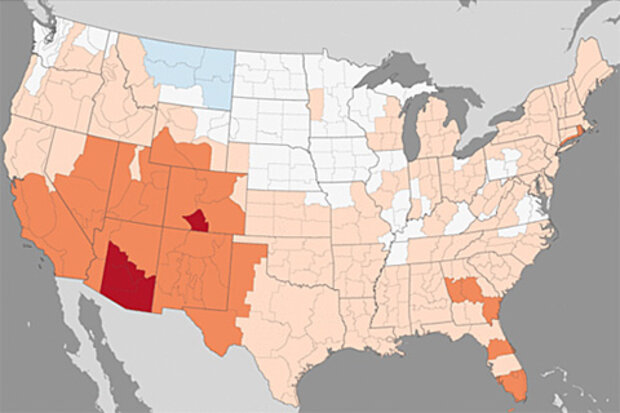
One of the handful of obscure meteorological/climatological seasons is the “cold season,” which in the U.S. runs from October through March. Now, I know it’s a stretch for a reader in, say, St. Paul to think of Arizona’s typical October-through-March average temperature in the upper 40s as a “cold season,” but it's all relative. For a state where the daytime high in the summer is 92F, the term "cold season" applies in Arizona, too.
Speaking of Arizona’s “cold season,” this was the warmest such season on…
Read article


