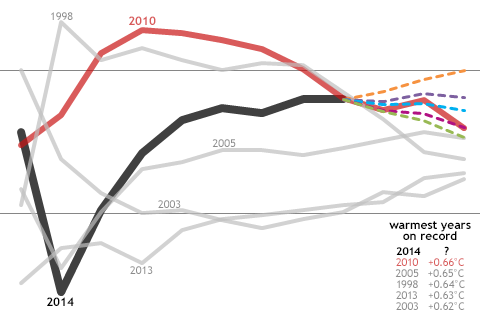
We're nine laps into the race to set a new global annual temperature record. NOAA climate scientist Deke Arndt talks about how this year's race might end--and why yearly rankings tell us less about the big picture of climate change than we might think.
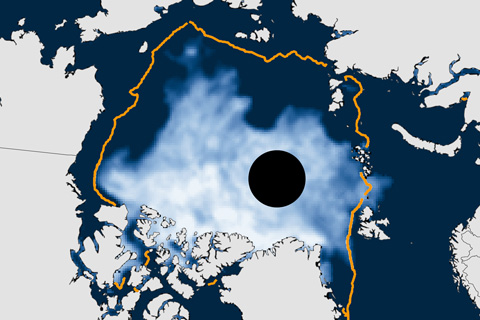
The annual minimum was 5.02 million square kilometers (1.94 million square miles), making 2014 the sixth smallest extent in the satellite era, which began in 1979.
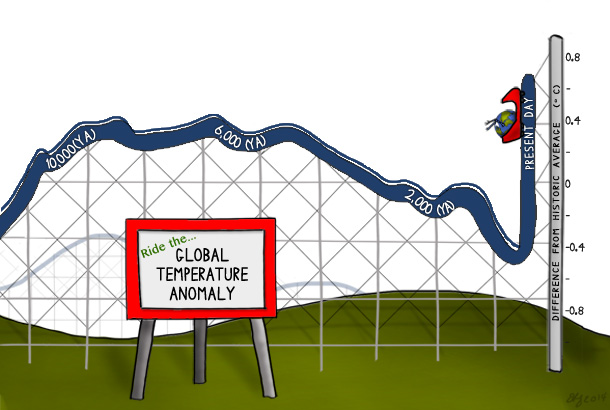
Natural variability can explain much of Earth's average temperature variation since the end of the last ice age, but over the past century, global average temperature has risen from near the coldest to the warmest levels in the past 11,300 years.
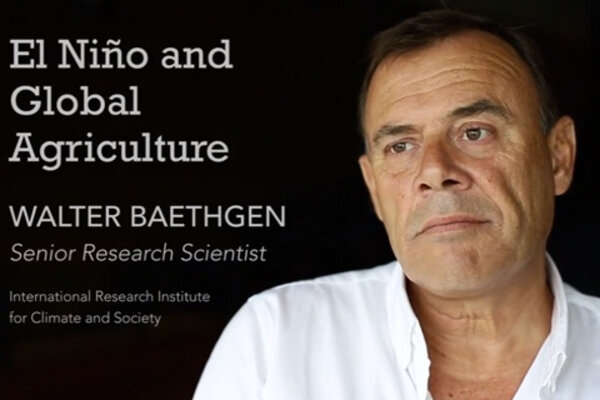
Walter Baethgen on El Niño and Global Agriculture
August 21, 2014
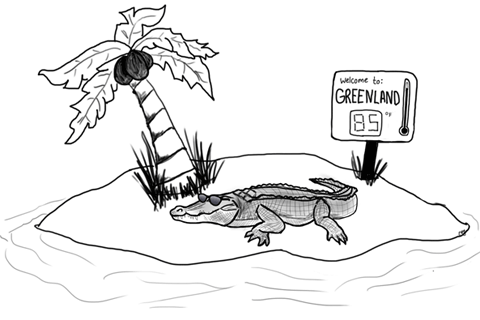
Earth’s hottest periods occurred before humans existed. Those ancient climates would have been like nothing our species has ever seen.
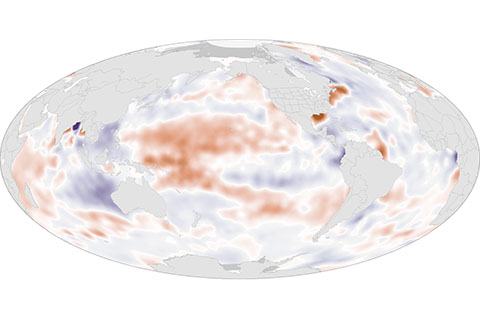
Across the globe, changes in salinity over time generally match changes in precipitation: places where rainfall declines become saltier, while places where rainfall increases become fresher. Where did saltiness change over the past decade?
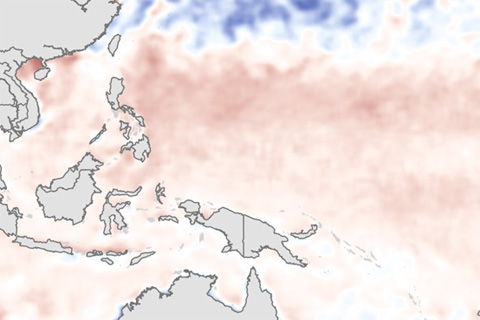
Through June, the eastern Pacific was warmer than average, but the lack of a strong gradient in sea surface temperature anomalies between the eastern and western Pacific may have kept the atmosphere from getting in sync with the developing El Niño.
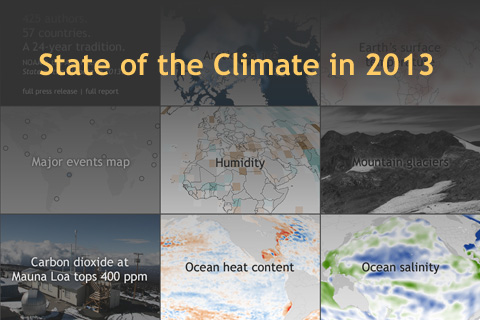
From the strongest typhoon ever observed to historically high atmospheric carbon dioxide levels, the State of the Climate in 2013 report provides a complete rundown on the state of Earth's climate and how it is changing.
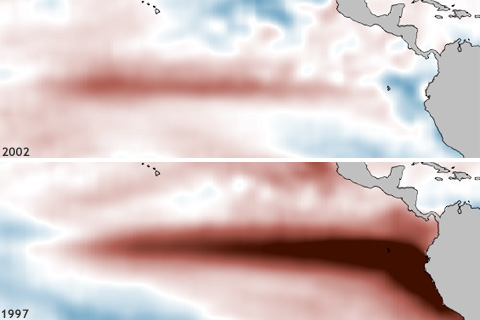
For the billions of people in Asia who depend on the Indian Monsoon for the majority of their yearly rainfall, the precise location where the Pacific warms during El Niño may be the difference between a relatively normal year and a devastating drought.
