It’s been a tough few weeks weather and climate wise. Big events generate lots of questions, so this edition of Beyond the Data will address several I’ve heard recently, and several I asked myself.
A blog by the nation’s official climate record keepers.
It’s been a tough few weeks weather and climate wise. Big events generate lots of questions, so this edition of Beyond the Data will address several I’ve heard recently, and several I asked myself.
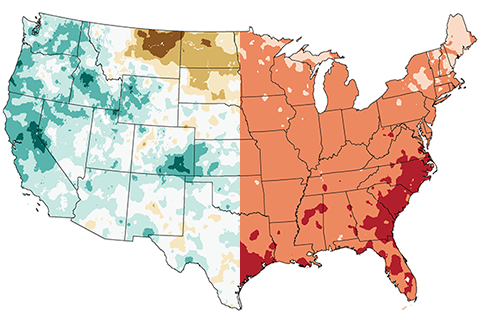
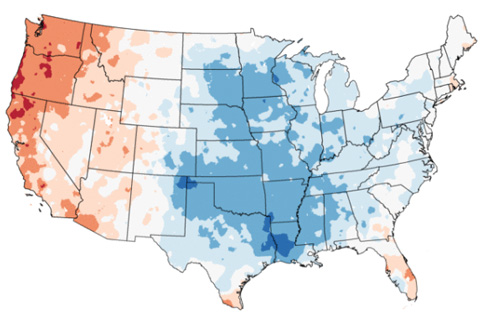
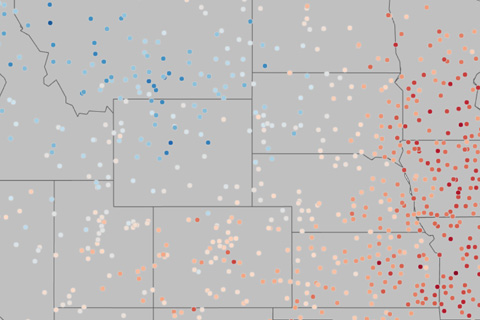
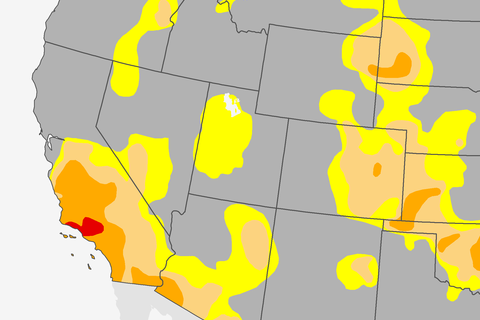
Normally, it's the dry years that are the hot ones in the United States. This year isn't playing by the rules.
In mid-March, a cold air outbreak brought freezing temperatures to the Southeast devastating crops and causing over $1 billion in agricultural losses. For those of us who love fruit this is bad news. In this Beyond the Data post, we explain why it was so devastating even though freezing temperatures in mid-March aren’t that unusual for the Southeast.
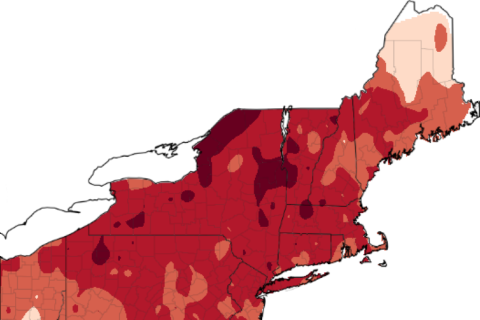
Yet another warm February left Northeast apple growers worrying if their crops will survive below-freezing spring temperatures. In this week's blog, Art DeGaetano of the Northeast Regional Climate Center talks about an online tool that helps apple growers estimate risk and damages to their yields based on bloom stage, historical climate data, and local temperature forecasts.
We’re about to go Beyond the Data in five ways. In keeping with the spirit of our blog, we’ll take a look at something obvious from the NCEI monthly climate analysis, then dig a little harder into some even more pertinent climatological truths.
A new analysis allows non-experts to view 2016 and year-to-date climate data for thousands of U.S. locations.
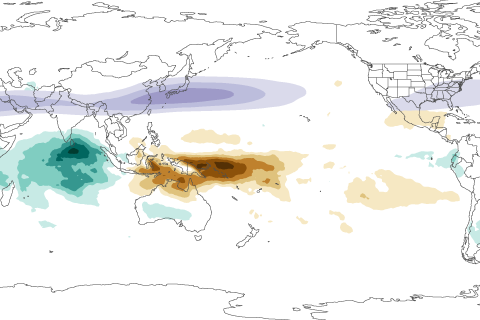
In this installment of our Beyond the Data blog, Carl Schreck talks about how a tropical climate pattern called the MJO left its fingerprints all over California's soaking rains and Boston's recent snowstorm.
Just a few days ago, on January 26th, 2017, we saw something in the U.S. climate that we hadn’t seen since March 2011.
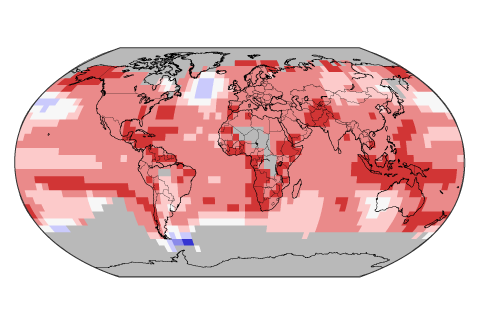
In 2016, the annual global temperature reached a record high for the third year in a row. How did this happen, and how unusual is it?
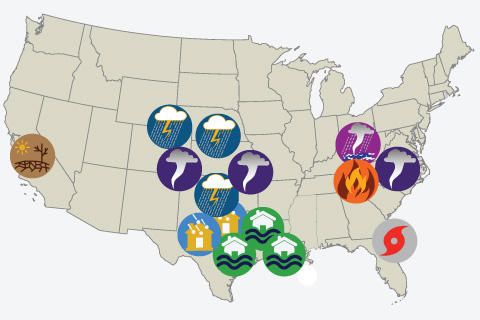
2016 saw 15 weather and climate disasters with losses exceeding $1 billion. How does that compares to history, and which disaster type was especially disruptive during the year?