October 2020 La Niña update
La Niña’s reign continues in the tropical Pacific, with an approximately 85% chance of lasting through the winter. Forecasters currently think this La Niña will be on the stronger side.
Let’s check in with the tropical Pacific
The temperature of the ocean surface in the Niño3.4 region was about 0.8°C cooler than the 1986–2015 average, according to the ERSSTv5 dataset. We monitor the Niño3.4 index with a few different temperature datasets—more on that here—but they are all comfortably below the La Niña threshold of -0.5°C. The three-month-average Niño3.4 index, called the Oceanic Niño Index (remember this for later!) was -0.6°C. The Oceanic Niño Index is our primary metric for the El Niño/Southern Oscillation, aka ENSO, the whole El Niño/La Niña ocean/atmosphere system.
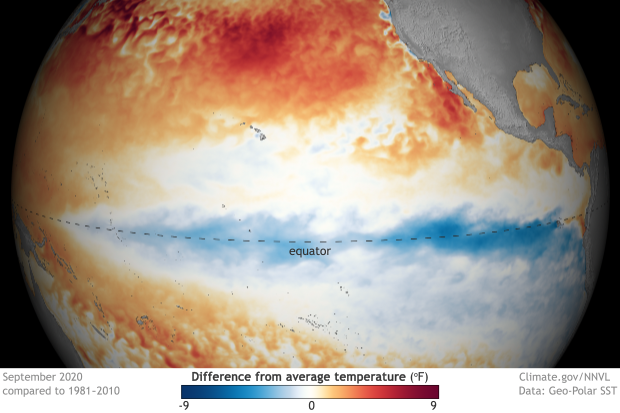
September 2020 sea surface temperature departure from the 1981-2010 average. Image from Data Snapshots on Climate.gov.
The atmosphere is responding to La Niña’s cooler-than-average ocean surface. A strengthened Walker circulation is what we expect with La Niña conditions, and it’s what we have: air rising vigorously over the very warm western Pacific, traveling eastward high up in the atmosphere, sinking over the cooler central-eastern Pacific, and traveling back westward near the surface.
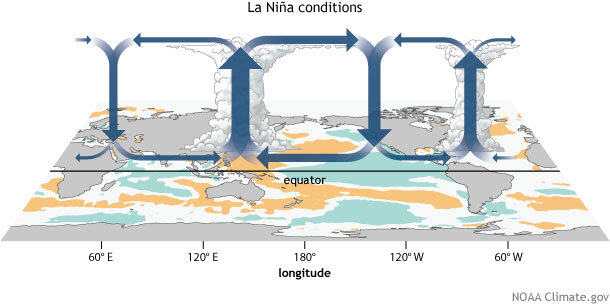
Generalized Walker Circulation (December-February) anomaly during La Niña events, overlaid on map of average sea surface temperature anomalies. Anomalous ocean cooling (blue-green) in the central and eastern Pacific Ocean and warming over the western Pacific Ocean enhance the rising branch of the Walker circulation over the Maritime Continent and the sinking branch over the eastern Pacific Ocean. Enhanced rising motion is also observed over northern South America, while anomalous sinking motion is found over eastern Africa. NOAA Climate.gov drawing by Fiona Martin.
Near-surface winds along the tropical Pacific (the trade winds) were stronger than average through the month of September and into early October, as were upper-level winds over the east-central Pacific. The two indexes we use to measure the change in sea-level pressure between the western and eastern Pacific, the Southern Oscillation Index and the Equatorial Southern Oscillation Index were positive, indicating the presence of more rising air (lower surface pressure) over the west and more sinking air (higher surface pressure) over the east—more evidence of an enhanced Walker circulation.
What’s on deck
Most of the dynamical computer model forecasts predict that La Niña will last through the winter and diminish in the spring. Also, there remains a substantial amount of cooler-than-average water under the surface of the central-eastern Pacific. This will provide a source of cooler water for the surface, giving confidence to the forecast that La Niña will continue.
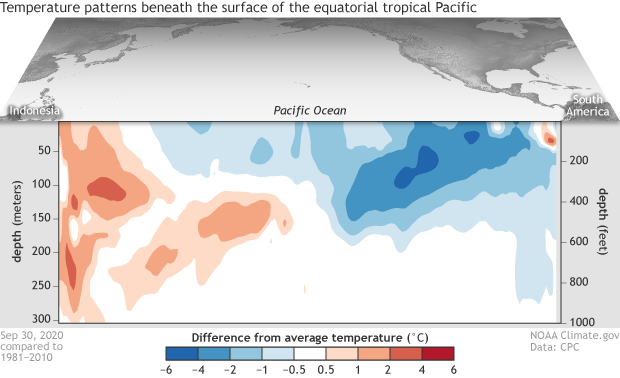
Departure from average of the surface and subsurface tropical Pacific sea temperature in September 2020. The vertical axis is depth below the surface (meters) and the horizontal axis is longitude, from the western to eastern tropical Pacific. This cross-section is right along the equator. Climate.gov figure from CPC data.
Several computer models are predicting the Oceanic Niño Index will be, at its peak in November–January, more than 1.0°C cooler than the long-term average. We don’t have specific strength definitions for ENSO, but generally, a deviation of more than 1.0°C (1.8°F) from the long-term mean is considered a moderate-to-strong event. Stronger ENSO events don’t necessarily increase the strength of global weather and climate impacts, but they do increase the likelihood that those impacts will occur.
Speaking of impacts…
The altered atmospheric circulation of ENSO affects global weather (here’s how that works in general and La Niña in specific). Since ENSO can be predicted months ahead of time, a lot of research has gone into understanding the patterns of ENSO’s global weather impacts. The idea is that if we can predict ENSO, we can get an early picture of what global weather could look like months into the future.
A recent study by some of our colleagues at the International Research Institute for Climate and Society (IRI), led by Nathan Lenssen, carefully re-assessed global precipitation (rain, snow, etc.) patterns during ENSO events. They looked at La Niña and El Niño impacts separately, because the impacts are not always opposite. Meaning, although El Niño may be related to a wet winter in one location, La Niña doesn’t necessarily mean a dry winter in that location.
Their study included every ENSO event from 1951–2016 where the peak strength, represented by the Oceanic Niño Index, was at least 1.0°C (for El Niño) or -1.0°C (for La Niña). This excludes weak or borderline ENSO events, when the atmospheric changes are not as consistent.
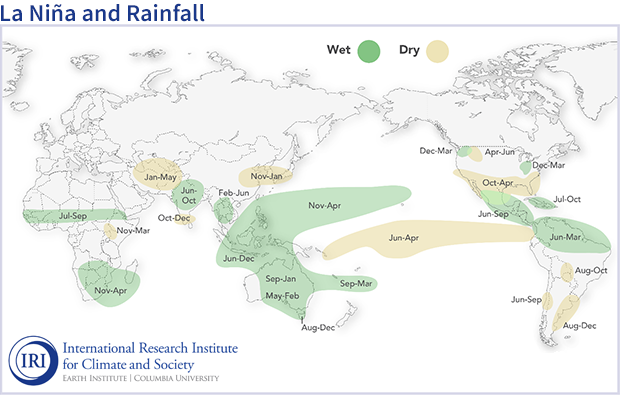
La Niña conditions in the tropical Pacific are known to shift rainfall patterns in many different parts of the world. The regions and seasons shown on this map indicate typical but not guaranteed impacts of La Niña. For further information, consult the probabilistic information that the map is based on. Image from the International Research Institute for Climate and Society (IRI).
Nathan’s team assembled this map, which may look familiar to ENSO Blog readers. While maps like these are very important for an overview of La Niña’s impacts, some people may need more information about how often the impacts occurred during past La Niña events. Fortunately, the IRI team has made this information available. You can select the three-month period, El Niño or La Niña, and above/below average precipitation, and the map will show you how often this impact has occurred. For example, 70% of past La Niña winters in Florida were drier than average. Warning—that maproom can be quite a time sink!
Turning impacts maps—either the one shown above, or probabilistic ones like on the IRI site—into an actual forecast can be a complicated process. (The second half of the IRI study assessed the accuracy of a few different forecasts based on ENSO impacts maps.) Official climate outlooks, like those from the Climate Prediction Center, take into consideration ENSO impacts, computer model forecasts, and knowledge of other climate patterns.
One thing you can be sure about is that we’ll be right here, keeping you posted on La Niña 2020/21 as it evolves! Well, I might be in the IRI maproom.
Comments
Temps in the North Pacific
RE: Temps in the North Pacific
It's somewhat typical to have above-average sea surface temperatures (SST) in the North Pacific Ocean during La Nina. You can see that here:
https://psl.noaa.gov/enso/compare/
If you click El Nino vs. La Nina and surface air temperatures, you can see the overall pattern you would expect.
With that said, one of the major differences with the 'expected' pattern right now is that often SSTs will cool off the West Coast of the U.S. and that doesn't appear to be happening so far.
ENSO Blog Newsletter?
RE: ENSO Blog Newsletter?
Sorry, but we don't have an email just for the blog. We do have a weekly newsletter that includes new content from across Climate.gov, and which includes the blog. You can subscribe to that from the page footer. Or if you just want to mark your calendar, the ENSO blog is published twice a month, on the second and fourth Thursday.
RE: ENSO Blog Newsletter?
We also have a email listserver that will notify folks when the ENSO status/forecast is updated once a month. You can subscribe to it by sending an email to: ncep.list.enso-update@noaa.gov
It will include a link to the official NOAA ENSO discussion:
https://www.cpc.ncep.noaa.gov/products/analysis_monitoring/enso_advisory/ensodisc.shtml
And in this discussion is a link to the ENSO blog, which us usually updated a couple hours after the official discussion.
Enso(El nino) and anti-enso(la Nina)
Oregon winter weather
RE: Oregon winter weather
I would recommend checking out the forecasts that are shown on this webpage. If you're interested in the winter (Dec-Feb) outlook here is the link: https://www.cpc.ncep.noaa.gov/products/predictions/long_range/seasonal.php?lead=3
Maps for North America
Are the 3 month weather prediction maps available for North America. For example, for the whole Great Lake Basin (Canada and the US)? Thanks.
La Nina Winter Impact
RE: La Nina Winter Impact
Seasonal forecasts from Environment and Climate Change Canada are here:
https://weather.gc.ca/saisons/prob_e.html
La Nina generally results in a tilt toward below-average temperatures for western Canada during the winter through spring. I believe current seasonal outlooks favor this pattern and also above-average temperatures for eastern Canada.
Investigación
Global warming induced climate change collapse and sealevel rise
London
RE: London
The UK Met Office issues seasonal outlooks on their webpage:
https://www.metoffice.gov.uk/services/government/international-development/climate-outlook
The rolling twenty years
RE: The rolling twenty years
The plan is to update the climatology to 1991-2020 starting with the January 2021 update. There are certainly some interesting jumps, but there always are when we do these climatology updates. Our last climatology update occurred in the middle of the 2015-16 major El Nino, so half of the event became part of the 1986-2015 climo and half did not.... as you can imagine, this is less than ideal, so will be nice to get that full event embedded within the coming climatology.
enso strength
RE: enso strength
La Niña’s reign continues in the tropical Pacific, with an approximately 85% chance of lasting through the winter. Forecasters currently think this La Niña will be on the stronger side.
Traducción al español
RE: Traducción al español
Unfortunately we don't have the resources to translate these blog posts into Spanish, but we do have our official monthly discussion translated into Spanish by WFO San Juan each month. These are updated on the 2nd Thursday of the month right here:
https://www.cpc.ncep.noaa.gov/products/analysis_monitoring/enso_advisory/
La niña
RE: La niña
Keep in mind that in any one area, there are multiple meteorological and climate factors and trends. I'm not familiar enough with the climate of Aruba to know what the prevailing factors are. However, La Nina does tilt the odds toward wetter conditions in that general vicinity. It never guarantees impacts however.
Surface Sea Temps outlook for Late Summer 2021
RE: Surface Sea Temps outlook for Late Summer 2021
For sea surface temperatures outside of the tropical Pacific Ocean, I highly recommend the monthly ocean briefing, which is available here:
https://www.cpc.ncep.noaa.gov/products/GODAS/
Hawaiian Island ( Big Island specifically ) rain pattern
RE: Hawaiian Island ( Big Island specifically ) rain pattern
There are outlooks for Hawaii provided as part of our regular seasonal updates:
https://www.cpc.ncep.noaa.gov/products/predictions/long_range/
(click Hawaiian discussion)
Also see our winter outlook here:
https://www.climate.gov/news-features/videos/2020-21-winter-outlook-leans-warm-and-dry-across-southern-us
La Nina results in a tilt in the odds toward wetter/warmer than average conditions during the N. Hemisphere winter
Forecast for Philippines
RE: Forecast for Philippines
La Niña conditions do mean a rainier winter on average for the Philippines (check the map above.) 2009 and 2013 weren't La Niña years, but I've reached out to a colleague who is a tropical cyclone expert with your question... I'll let you know what he says!
montana snow
Southeast Alaska pattern
RE: Southeast Alaska pattern
THe seasonal outlook for January - March 2021 does slightly favor below average temperatures and below average precipitation, although we're not seeing strong signs of that occuring during the remainder of December or early January.
Impact of lack of contrails
Add new comment